
В этой статье я задался целью раз и навсегда разрешить все вопросы по централизованному сбору логов, их визуализации, отправки уведомление по наступившим событиям, настройке форматов логов и предоставление докер контейнер, которые облегчат эти задачи для всех кто с этим столкнется.
Содержание
- 1. Настраиваем кластер для сбора логов на основе syslog-ng,elasticsearch,kibana,graphana,elasticalert
- 2. Настраиваем агенты на клиентах и форматы логов для отправки в агрегатор
- 3. Различные сниппеты по логам
- 4. Исправление ошибок
- 5. Syslog-ng module incubator
- 6. Запросы в kibana
- 7. Syslog-ng alerts на события
Настраиваем кластер для сбора логов на основе syslog-ng,elasticsearch,kibana,graphana,elasticalert
Наш кластер будет состоять из 4 нод.
10.9.3.210 	elasticsearch-node1 elasticnode1
10.9.3.211      elasticsearch-node2 elasticnode2
10.9.3.212      elasticsearch-node3 elasticnode3
10.9.3.213      elasticsearch-node3 elasticnode4
1 нода – elasticsearch master нода, syslog-ng агрегатор логов, kibana и graphana для визуализации логов, elasticalert для реагирования на события по логам(например большого количества 500 ошибок nginx в определенный период времени).
2 нода – elasticsearch data нода
3 нода – elasticsearch data нода
4 нода – elasticsearch data нода(это уже как хотите)
На всех нодах установлена debian 8 с ядром 4.9.0. Как показала практика одна из стабильных связок.
Установка syslog-ng
Удаляем rsyslog
sudo systemctl disable rsyslog
sudo systemctl stop rsyslog
Ставим необхдимые системные пакеты
apt-get install apt-transport-https -y
Ставим java на debian 8
apt-get update && apt-get install -t jessie-backports openjdk-8-jre-headless  -y
 apt-get install -t jessie-backports openjdk-8-jre-headless  -y
update-java-alternatives --set java-1.8.0-openjdk-amd64
Ставим java на ubuntu
sudo apt-get install openjdk-8-jre-headless -y
Устанавливаем переменную окружения
Правим файл
/etc/default/syslog-ng
Добавляем
LD_LIBRARY_PATH=/usr/lib/jvm/java-8-openjdk-amd64/jre/lib/amd64/server:$LD_LIBRARY_PATH
Делаем Export – для того чтобы дебажить через запуска без демона
export LD_LIBRARY_PATH=/usr/lib/jvm/java-8-openjdk-amd64/jre/lib/amd64/server:$LD_LIBRARY_PATH
Ставим syslog-ng последней версии на debian 8. Можем собрать из исходников
wget http://ftp.ru.debian.org/debian/pool/main/o/openssl/libssl1.0.0_1.0.1t-1+deb8u6_amd64.deb && dpkg -i libssl1.0.0_1.0.1t-1+deb8u6_amd64.deb
wget http://ftp.ru.debian.org/debian/pool/main/j/json-c/libjson-c2_0.11-4_amd64.deb && dpkg -i libjson-c2_0.11-4_amd64.deb
wget -qO - http://download.opensuse.org/repositories/home:/laszlo_budai:/syslog-ng/Debian_8.0/Release.key | sudo apt-key add -
echo "deb http://download.opensuse.org/repositories/home:/laszlo_budai:/syslog-ng/Debian_8.0 ./" >> /etc/apt/sources.list.d/syslog-ng-obs.list
apt-get update
apt-get install -y syslog-ng-core syslog-ng-mod-pgsql libdbd-pgsql syslog-ng-mod-elastic
Ставим syslog-ng последней версии на ubuntu 16.04
sudo su
wget http://nl.archive.ubuntu.com/ubuntu/pool/main/j/json-c/libjson-c3_0.12.1-1.1_amd64.deb && dpkg -i libjson-c3_0.12.1-1.1_amd64.de
wget -qO - http://download.opensuse.org/repositories/home:/laszlo_budai:/syslog-ng/Debian_8.0/Release.key | sudo apt-key add -
echo "deb http://download.opensuse.org/repositories/home:/laszlo_budai:/syslog-ng/xUbuntu_16.10 ./" >> /etc/apt/sources.list.d/syslog-ng-obs.list
apt-get update
apt-get install syslog-ng-core syslog-ng-mod-pgsql libdbd-pgsql syslog-ng-mod-elastic
Ставим последний elasticsearch и kibana на все ноды
wget http://ftp.ru.debian.org/debian/pool/main/o/openssl/libssl1.0.0_1.0.1t-1+deb8u6_amd64.deb && dpkg -i libssl1.0.0_1.0.1t-1+deb8u6_amd64.deb
 wget http://ftp.ru.debian.org/debian/pool/main/j/json-c/libjson-c2_0.11-4_amd64.deb && dpkg -i libjson-c2_0.11-4_amd64.deb
 echo "deb http://http.debian.net/debian jessie-backports main" >> /etc/apt/sources.list.d/jessie-backports.list
 apt-get update && apt-get install -t jessie-backports openjdk-8-jre-headless  -y
 update-java-alternatives --set java-1.8.0-openjdk-amd64
 wget -qO - https://artifacts.elastic.co/GPG-KEY-elasticsearch | apt-key add -
 echo "deb https://artifacts.elastic.co/packages/5.x/apt stable main" >> /etc/apt/sources.list.d/elastic-5.x.list
 apt-get update &&  apt-get install elasticsearch  kibana -y
 echo "LD_LIBRARY_PATH=/usr/lib/jvm/java-8-openjdk-amd64/jre/lib/amd64/server:$LD_LIBRARY_PATH" >> /root/.profile
 echo "LD_LIBRARY_PATH=/usr/lib/jvm/java-8-openjdk-amd64/jre/lib/amd64/server:$LD_LIBRARY_PATH" >> ~/.bash_profile
 mkdir /elasticsearchdata/ && chown -R elasticsearch:elasticsearch /elasticsearchdata/
update-rc.d elasticsearch defaults 95 10
sudo /bin/systemctl daemon-reload
sudo /bin/systemctl enable elasticsearch.service
Правим системные файлы.
Правим limits.conf
nano /etc/security/limits.conf
        *          hard  memlock   unlimited
        *          soft  memlock   unlimited
        root       soft  nproc     unlimited
        root       soft  nofile    65536
        root       hard  nofile    65536
        *          soft  nofile    65536
        *          hard  nofile    65536
        *          -     nofile    999999
elasticsearch    soft    nofile          65535
elasticsearch    hard    nofile          65535
elasticsearch    soft    memlock         unlimited
elasticsearch    hard    memlock         unlimited
Правим sysctl.conf
nano /etc/sysctl.conf
vm.swappiness=1
vm.max_map_count=262144
net.ipv4.tcp_wmem = 4096 65536 16777216
net.ipv4.tcp_wmem = 4096 262144 4194304
net.ipv4.tcp_window_scaling = 1
net.ipv4.tcp_tw_reuse  =  1
net.ipv4.tcp_tw_recycle  =  1
net.ipv4.tcp_timestamps = 1
net.ipv4.tcp_syncookies = 0
net.ipv4.tcp_synack_retries = 1
net.ipv4.tcp_sack = 1
net.ipv4.tcp_rmem = 4096 262144 4194304
net.ipv4.tcp_rfc1337 = 1
net.ipv4.tcp_orphan_retries = 0
net.ipv4.tcp_no_metrics_save = 1
net.ipv4.tcp_moderate_rcvbuf = 1
net.ipv4.tcp_mem = 50576   64768   98152
net.ipv4.tcp_max_syn_backlog = 65536
net.ipv4.tcp_max_orphans = 65536
net.ipv4.tcp_keepalive_time = 600
net.ipv4.tcp_keepalive_probes = 20
net.ipv4.tcp_keepalive_intvl = 60
net.ipv4.tcp_fin_timeout = 10
net.ipv4.tcp_congestion_control = htcp
net.ipv4.tcp_adv_win_scale = 2
net.ipv4.route.flush = 1
net.ipv4.ip_local_port_range = 10240 65535
net.ipv4.ip_forward = 1
net.ipv4.icmp_ignore_bogus_error_responses = 1
net.ipv4.icmp_echo_ignore_broadcasts = 1
net.ipv4.icmp_echo_ignore_all = 1
net.ipv4.conf.lo.rp_filter = 1
net.ipv4.conf.lo.accept_source_route = 0
net.ipv4.conf.default.rp_filter = 1
net.ipv4.conf.default.accept_source_route = 0
net.ipv4.conf.all.send_redirects = 0
net.ipv4.conf.all.secure_redirects = 0
net.ipv4.conf.all.rp_filter = 1
net.ipv4.conf.all.accept_source_route = 0
net.ipv4.conf.all.accept_redirects = 0
net.core.wmem_default = 65536
net.core.somaxconn = 65535
net.core.rmem_default = 65536
net.core.netdev_max_bacтlog = 100000
kernel.sem = 350 358400 64 1024
fs.inotify.max_user_watches = 67108864
fs.file-max = 518144
настраиваем kibana и elasticsearch
НАстроим на макимальное использование памяти
в /usr/lib/systemd/system/elasticsearch.service
[Service]
LimitMEMLOCK=infinityy
И
systemctl daemon-reload
Отредактируем файл на всех нодах
nano /etc/elasticsearch/jvm.options
Блок – делаем половину озу – у меня 12 – поставил 6
# Xms represents the initial size of total heap space
# Xmx represents the maximum size of total heap space
-Xms6g
-Xmx6g
Конфиг master ноды elasticsearch
nano /etc/elasticsearch/elasticsearch.yml
## Default Elasticsearch configuration from elasticsearch-docker.
## from https://github.com/elastic/elasticsearch-docker/blob/master/build/elasticsearch/elasticsearch.yml
#
network.host: 0.0.0.0
cluster.name: "production"
node.name: elasticnode1
discovery.zen.ping.unicast.hosts: ["elasticnode1", "elasticnode2", "elasticnode3"]
# avoid swapping the Elasticsearch
bootstrap.memory_lock: true
###Make node master - non data
node.master: true
node.data: false
# minimum_master_nodes need to be explicitly set when bound on a public IP
discovery.zen.minimum_master_nodes: 1
path.data: /elasticsearchdata/
#
# Path to log files:
#
#path.logs: /path/to/logs
## Use single node discovery in order to disable production mode and avoid bootstrap checks
## see https://www.elastic.co/guide/en/elasticsearch/reference/current/bootstrap-checks.html
#
#discovery.type: single-node
## Disable X-Pack
## see https://www.elastic.co/guide/en/x-pack/current/xpack-settings.html
##     https://www.elastic.co/guide/en/x-pack/current/installing-xpack.html#xpack-enabling
#
#xpack.security.enabled: false
#xpack.monitoring.enabled: false
#xpack.ml.enabled: false
#xpack.graph.enabled: false
#xpack.watcher.enabled: false
rm -rf /var/lib/elasticsearch/*
/etc/init.d/elasticsearch restart
Смотрим здоровье и статус кластера
curl -XGET 'http://elastinode1:9200/_cluster/state?pretty'
curl http://elastinode:9200/_nodes/process?pretty
Следующая команда должна показать
curl -XGET 'http://localhost:9200/_cluster/health'
Такой вывод
{"cluster_name":"production","status":"green","timed_out":false,"number_of_nodes":4,"number_of_data_nodes":3,"active_primary_shards":41,"active_shards":82,"relocating_shards":0,"initializing_shards":0,"unassigned_shards":0,"delayed_unassigned_shards":0,"number_of_pending_tasks":0,"number_of_in_flight_fetch":0,"task_max_waiting_in_queue_millis":0,"active_shards_percent_as_number":100.0}
Конфиг dataноды elasticsearch elasticnode2
nano /etc/elasticsearch/elasticsearch.yml
---
## Default Elasticsearch configuration from elasticsearch-docker.
## from https://github.com/elastic/elasticsearch-docker/blob/master/build/elasticsearch/elasticsearch.yml
#
network.host: 0.0.0.0
cluster.name: "production"
node.name: elasticnode2
discovery.zen.ping.unicast.hosts: ["elasticnode1", "elasticnode2", "elasticnode3"]
# avoid swapping the Elasticsearch
bootstrap.memory_lock: true
###Make node master - non data
node.master: false
node.data: true
# minimum_master_nodes need to be explicitly set when bound on a public IP
discovery.zen.minimum_master_nodes: 1
path.data: /elasticsearchdata/
#
# Path to log files:
#
#path.logs: /path/to/logs
## Use single node discovery in order to disable production mode and avoid bootstrap checks
## see https://www.elastic.co/guide/en/elasticsearch/reference/current/bootstrap-checks.html
#
#discovery.type: single-node
## Disable X-Pack
## see https://www.elastic.co/guide/en/x-pack/current/xpack-settings.html
##     https://www.elastic.co/guide/en/x-pack/current/installing-xpack.html#xpack-enabling
#
#xpack.security.enabled: false
#xpack.monitoring.enabled: false
#xpack.ml.enabled: false
#xpack.graph.enabled: false
#xpack.watcher.enabled: false
Конфиг dataноды elasticsearch elasticnode3
nano /etc/elasticsearch/elasticsearch.yml
---
## Default Elasticsearch configuration from elasticsearch-docker.
## from https://github.com/elastic/elasticsearch-docker/blob/master/build/elasticsearch/elasticsearch.yml
#
network.host: 0.0.0.0
cluster.name: "production"
node.name: elasticnode3
discovery.zen.ping.unicast.hosts: ["elasticnode1", "elasticnode2", "elasticnode3"]
# avoid swapping the Elasticsearch
bootstrap.memory_lock: true
###Make node master - non data
node.master: false
node.data: true
# minimum_master_nodes need to be explicitly set when bound on a public IP
discovery.zen.minimum_master_nodes: 1
path.data: /elasticsearchdata/
#
# Path to log files:
#
#path.logs: /path/to/logs
## Use single node discovery in order to disable production mode and avoid bootstrap checks
## see https://www.elastic.co/guide/en/elasticsearch/reference/current/bootstrap-checks.html
#
#discovery.type: single-node
## Disable X-Pack
## see https://www.elastic.co/guide/en/x-pack/current/xpack-settings.html
##     https://www.elastic.co/guide/en/x-pack/current/installing-xpack.html#xpack-enabling
#
#xpack.security.enabled: false
#xpack.monitoring.enabled: false
#xpack.ml.enabled: false
#xpack.graph.enabled: false
#xpack.watcher.enabled: false
Конфиг kibana
nano /etc/kibana/kibana.yml
---
---
## Default Kibana configuration from kibana-docker.
## from https://github.com/elastic/kibana-docker/blob/master/build/kibana/config/kibana.yml
#
server.name: kibana.local
server.host: "0"
elasticsearch.url: http://elasticnode1:9200
## Disable X-Pack
## see https://www.elastic.co/guide/en/x-pack/current/xpack-settings.html
##     https://www.elastic.co/guide/en/x-pack/current/installing-xpack.html#xpack-enabling
#
xpack.security.enabled: false
xpack.security.enabled: false
xpack.monitoring.enabled: false
xpack.ml.enabled: false
xpack.graph.enabled: false
xpack.reporting.enabled: false
Рестартуес сервисы
/etc/init.d/elasticsearch restart
/etc/init.d/kibana restart
Подготовка формата логов nginx,php и nodejs
Настройка формата логов в nginx
Ставим nginx mainline с GEOIP или собираем из исходников. Проблем не будет.
wget http://nginx.org/keys/nginx_signing.key
apt-key add nginx_signing.key
echo "deb http://nginx.org/packages/mainline/debian/ jessie nginx" >> /etc/apt/sources.list.d/nginx.list
echo "deb-src http://nginx.org/packages/mainline/debian/ jessie nginx" >> /etc/apt/sources.list.d/nginx.list
apt-get update
apt install -y nginx-module-geoip nginx -y
Скачиваем бызы geoip и рапаковываем
mkdir -p /etc/nginx/GEO
cd /etc/nginx/GEO
wget -N http://geolite.maxmind.com/download/geoip/database/GeoLiteCountry/GeoIP.dat.gz
wget -N http://geolite.maxmind.com/download/geoip/database/GeoLiteCity.dat.gz
gunzip GeoIP.dat.gz
gunzip GeoLiteCity.dat.gz
nano /etc/nginx/nginx.conf
Добавляем формат логов и включаем запись их в файлы
###В самую верхнюю секцию
load_module /usr/lib/nginx/modules/ngx_http_geoip_module.so;
load_module /usr/lib/nginx/modules/ngx_stream_geoip_module.so;
##В секцию http {
geoip_country /etc/nginx/GEO/GeoIP.dat;
geoip_city    /etc/nginx/GEO/GeoLiteCity.dat
proxy_set_header GEOIP_COUNTRY_CODE $geoip_country_code;
proxy_set_header GEOIP_COUNTRY_CODE3 $geoip_country_code3;
proxy_set_header GEOIP_COUNTRY_NAME $geoip_city_country_name;
proxy_set_header GEOIP_CITY_COUNTRY_CODE $geoip_city_country_code;
proxy_set_header GEOIP_CITY_COUNTRY_CODE3 $geoip_city_country_code3;
proxy_set_header GEOIP_CITY_COUNTRY_NAME $geoip_city_country_name;
proxy_set_header GEOIP_REGION $geoip_region;
proxy_set_header GEOIP_CITY $geoip_city;
proxy_set_header GEOIP_POSTAL_CODE $geoip_postal_code;
proxy_set_header GEOIP_CITY_CONTINENT_CODE $geoip_city_continent_code;
proxy_set_header GEOIP_LATITUDE $geoip_latitude;
proxy_set_header GEOIP_LONGITUDE $geoip_longitude;
log_format logtodb '"$time_iso8601"|"$http_host"|"$remote_addr"|"$http_x_forwarded_for"|"$request_method"|"$request"|"$status"|"$body_bytes_sent"|"$http_referer"|"$request_time"|"$upstream_http_x_cache"|"$uri"|"$upstream_addr"|"$host"|"$upstream_response_length"|"$upstream_status"|"$server_name"|"$http_host"|"$upstream_response_time"|"$upstream_cache_status"|"$http_user_agent"';
log_format full_format '"$time_iso8601"|"$http_host"|"$remote_addr"|"$http_x_forwarded_for"|"$request_method"|"$request"|"$status"|"$body_bytes_sent"|"$http_referer"|"$request_time"|"$upstream_http_x_cache"|"$uri"|"$upstream_addr"|"$host"|"$upstream_response_length"|"$upstream_status"|"$server_name"|"$http_host"|"$upstream_response_time"|"$upstream_cache_status"|"$http_user_agent"|"$geoip_city"|"$geoip_country_name"|"$geoip_region"|"$cookie_COOKIE"';
access_log /var/log/nginx/access_logtodb.log logtodb;
access_log /var/log/nginx/access_main.log full_format;
error_log /var/log/nginx/error.log;
Настройка логов php – отправка их в nginxerror.log
Добаляем в конфиг, например у мея это
nano /php/7.0/fpm/pool.d/itc-life.ru.conf
 catch_workers_output = yes
php_flag[display_errors] = on
php_admin_value[error_log] = /var/log/fpm-php.www.log
php_admin_flag[log_errors] = on
Таким образом логи ошибок будут php будут попадать в nginx error log.
Идем далее.
Настройка формата логов nodejs, запускаемой через pm2
Делаем запуск с такими параметрами
pm2 start server.js --merge-logs --log-type=json --log-date-format="YYYY-MM-DD HH:mm Z" -i 4 --watch --max-memory-restart 1200M
Логи будет писаться в одну строку в json формате. Хотя это г. все равно не пишет логи как надо – выскакивает из json.
На этом подготовка формата логов окончена
Настраиваем syslog-ng на отправку логов nginx,php и nodejs через udp или tcp на сервер логов
Приведем syslog-ng к определенному виду. У нас на текущий момент версия 3.12
nano/etc/syslog-ng/syslog-ng.conf
@version: 3.12
@include "scl.conf"
#@module mod-java
# Настраиваем глобальные параметры
options {
chain_hostnames(off);
log_fifo_size(1000);
use_dns(no);
use_fqdn(no);
owner("root");
group("adm");
perm(0640);
stats_freq(0);
bad_hostname("^gconfd$");
};
@include "/etc/syslog-ng/conf.d/*.conf"
Все конфиги будем инклудить для удобства через conf.d. Конфиг для парсинга созданных нами логов и отправки их на сервер. Шлем по udp и tcp – кому как нравиться – tcp с флагом flow-control – контроль очереди на приемнике.
nano /etc/syslog-ng/conf.d/output.conf
#####################################################################################################################
####Отправка логов на сервер
destination tcp_server_nginx_access {
 tcp("elasticnode1" port(25214));
 };
destination tcp_server_nginx_error {
 tcp("elasticnode1" port(25215));
 };
destination tcp_server_nodejs {
 tcp("elasticnode1" port(25216));
 };
####Отправка логов на сервер
destination udp_server_nginx_access {
 udp("elasticnode1" port(25214));
 };
destination udp_server_nginx_error {
 udp("elasticnode1" port(25215));
 };
destination udp_server_nodejs {
 udp("elasticnode1" port(25216));
 };
#########################################################################
###### Источник с логами nginx access##################
source s_tail_nginx_access_log { file( "/var/log/nginx/access_logtodb.log"
                    follow_freq(1)
                    flags(no-parse)
     );
};
###########################################################################################################
###### Источник с логами nginx error##################
source s_tail_nginx_error  { file( "/var/log/nginx/error.log"
                    follow_freq(1)
                    flags(no-parse)
     );
};
###########################################################################################################
####Источник с логами nodejs
source s_tail_node  { file( "/root/.pm2/logs/server-error.log"
                    follow_freq(1)
                    flags(no-parse)
     );
};
###Отпарвляем все источники на сервер - там их будем парсить и писать в нужные базы.
log {source(s_tail_nginx_access_log);  destination(udp_server_nginx_access); };
log {source(s_tail_nginx_error ); destination(udp_server_nginx_error);};
log {source(s_tail_node); destination(udp_server_nodejs);};
log {source(s_tail_nginx_access_log);  destination(tcp_server_nginx_access); flags(flow-control);};
log {source(s_tail_nginx_error ); destination(tcp_server_nginx_error);flags(flow-control);};
log {source(s_tail_node); destination(tcp_server_nodejs);flags(flow-control);};
Далее отдельным файлом выделим файл access с geoip. В принципе можете оставить только его.
nano /etc/syslog-ng/conf.dudp_remote_log_host_nginx_main.conf
#####################################################################################################################
#####################################################################################################################
####Отправка логов на сервер
destination udp_remote_log_host_nginx_main {
 udp("elasticnode1" port(25230));
 };
#########################################################################
###### Источник с логами nginx access##################
source s_tail_log_host_nginx_main { file( "/var/log/nginx/access_main.log"
                    follow_freq(1)
                    flags(no-parse)
     );
};
###Отпарвляем все источники на сервер - там их будем парсить и писать в нужные базы.
log {source(s_tail_log_host_nginx_main); destination(udp_remote_log_host_nginx_main);};
Далее отдельным файлом выделим стандартные системные логи
nano /etc/syslog-ng/conf.d/system.logs.conf
Вставляем содержимое
########################
# Sources
########################
# This is the default behavior of sysklogd package
# Logs may come from unix stream, but not from another machine.
#
source s_src {
       system();
       internal();
};
# If you wish to get logs from remote machine you should uncomment
# this and comment the above source line.
#
#source s_net { tcp(ip(127.0.0.1) port(1000)); };
########################
# Destinations
########################
# First some standard logfile
#
destination d_auth { file("/var/log/auth.log"); };
destination d_cron { file("/var/log/cron.log"); };
destination d_daemon { file("/var/log/daemon.log"); };
destination d_kern { file("/var/log/kern.log"); };
destination d_lpr { file("/var/log/lpr.log"); };
destination d_mail { file("/var/log/mail.log"); };
destination d_syslog { file("/var/log/syslog"); };
destination d_user { file("/var/log/user.log"); };
destination d_uucp { file("/var/log/uucp.log"); };
# This files are the log come from the mail subsystem.
#
destination d_mailinfo { file("/var/log/mail.info"); };
destination d_mailwarn { file("/var/log/mail.warn"); };
destination d_mailerr { file("/var/log/mail.err"); };
# Logging for INN news system
#
destination d_newscrit { file("/var/log/news/news.crit"); };
destination d_newserr { file("/var/log/news/news.err"); };
destination d_newsnotice { file("/var/log/news/news.notice"); };
# Some 'catch-all' logfiles.
#
destination d_debug { file("/var/log/debug"); };
destination d_error { file("/var/log/error"); };
destination d_messages { file("/var/log/messages"); };
# The root's console.
#
destination d_console { usertty("root"); };
# Virtual console.
#
destination d_console_all { file(`tty10`); };
# The named pipe /dev/xconsole is for the nsole' utility.  To use it,
# you must invoke nsole' with the -file' option:
#
#    $ xconsole -file /dev/xconsole [...]
#
destination d_xconsole { pipe("/dev/xconsole"); };
# Send the messages to an other host
#
#destination d_net { tcp("127.0.0.1" port(1000) log_fifo_size(1000)); };
# Debian only
destination d_ppp { file("/var/log/ppp.log"); };
########################
# Filters
########################
# Here's come the filter options. With this rules, we can set which
# message go where.
filter f_dbg { level(debug); };
filter f_info { level(info); };
filter f_notice { level(notice); };
filter f_warn { level(warn); };
filter f_err { level(err); };
filter f_crit { level(crit .. emerg); };
filter f_debug { level(debug) and not facility(auth, authpriv, news, mail); };
filter f_error { level(err .. emerg) ; };
filter f_messages { level(info,notice,warn) and
                    not facility(auth,authpriv,cron,daemon,mail,news); };
filter f_auth { facility(auth, authpriv) and not filter(f_debug); };
filter f_cron { facility(cron) and not filter(f_debug); };
filter f_daemon { facility(daemon) and not filter(f_debug); };
filter f_kern { facility(kern) and not filter(f_debug); };
filter f_lpr { facility(lpr) and not filter(f_debug); };
filter f_local { facility(local0, local1, local3, local4, local5,
                        local6, local7) and not filter(f_debug); };
filter f_mail { facility(mail) and not filter(f_debug); };
filter f_news { facility(news) and not filter(f_debug); };
filter f_syslog3 { not facility(auth, authpriv, mail) and not filter(f_debug); };
filter f_user { facility(user) and not filter(f_debug); };
filter f_uucp { facility(uucp) and not filter(f_debug); };
filter f_cnews { level(notice, err, crit) and facility(news); };
filter f_cother { level(debug, info, notice, warn) or facility(daemon, mail); };
filter f_ppp { facility(local2) and not filter(f_debug); };
filter f_console { level(warn .. emerg); };
########################
# Log paths
########################
########################
# SSh logins logs
########################
destination tcp_remote_log_host_ssh {
 tcp("elasticnode1" port(40514));
 };
destination udp_remote_log_host_ssh {
 udp("elasticnode1" port(40514));
 };
log { source(s_src); filter(f_auth); destination(d_auth); };
log { source(s_src); filter(f_auth); destination(udp_remote_log_host_ssh); };
########################
# crons logs
########################
destination tcp_remote_log_host_crons {
 tcp("elasticnode1" port(40515));
 };
destination udp_remote_log_host_crons  {
 udp("elasticnode1" port(40515));
 };
log { source(s_src); filter(f_cron); destination(udp_remote_log_host_crons); };
########################
# daemon logs
########################
destination tcp_remote_log_host_daemon {
 tcp("elasticnode1" port(40516));
 };
destination udp_remote_log_host_daemon  {
 udp("elasticnode1" port(40516));
 };
log { source(s_src); filter(f_daemon); destination(udp_remote_log_host_daemon); };
########################
# kern logs
########################
destination tcp_remote_log_host_kern {
 tcp("elasticnode1" port(40517));
 };
destination udp_remote_log_host_kern  {
 udp("elasticnode1" port(40517));
 };
log { source(s_src); filter(f_kern); destination(udp_remote_log_host_kern); };
########################
# user logs
########################
destination tcp_remote_log_host_user {
 tcp("elasticnode1" port(40518));
 };
destination udp_remote_log_host_user  {
 udp("elasticnode1" port(40518));
 };
log { source(s_src); filter(f_user); destination(udp_remote_log_host_user); };
########################
#  lpr logs
########################
destination tcp_remote_log_host_lpr {
 tcp("elasticnode1" port(40519));
 };
destination udp_remote_log_host_lpr {
 udp("elasticnode1" port(40519));
 };
log { source(s_src); filter(f_lpr); destination(udp_remote_log_host_lpr); };
########################
#  syslog logs
########################
destination tcp_remote_log_host_syslog {
 tcp("elasticnode1" port(40520));
 };
destination udp_remote_log_host_syslog {
 udp("elasticnode1" port(40520));
 };
log { source(s_src); filter(f_syslog3); destination(udp_remote_log_host_syslog ); };
########################
#  uucp logs
########################
destination tcp_remote_log_host_uucp {
 tcp("elasticnode1" port(40521));
 };
destination udp_remote_log_host_uucp {
 udp("elasticnode1" port(40521));
 };
log { source(s_src); filter(f_uucp); destination(udp_remote_log_host_uucp ); };
########################
#  mail logs
########################
destination tcp_remote_log_host_mail {
 tcp("elasticnode1" port(40522));
 };
destination udp_remote_log_host_mail {
 udp("elasticnode1" port(40522));
 };
log { source(s_src); filter(f_mail); destination(udp_remote_log_host_mail); };
########################
#  messages logs
########################
destination tcp_remote_log_host_messages {
 tcp("elasticnode1" port(40523));
 };
destination udp_remote_log_host_messages{
 udp("elasticnode1" port(40523));
 };
log { source(s_src); filter(f_messages); destination(udp_remote_log_host_messages); };
########################
#  debug logs
########################
destination tcp_remote_log_host_debug {
 tcp("elasticnode1" port(40524));
 };
destination udp_remote_log_host_debug {
 udp("elasticnode1" port(40524));
 };
log { source(s_src); filter(f_debug); destination(udp_remote_log_host_debug); };
log { source(s_src); filter(f_debug); destination(d_debug); };
########################
#  error logs
########################
destination tcp_remote_log_host_error {
 tcp("elasticnode1" port(40525));
 };
destination udp_remote_log_host_error {
 udp("elasticnode1" port(40525));
 };
log { source(s_src); filter(f_error); destination(udp_remote_log_host_error); };
###Неактивные за отсутствием
log { source(s_src); filter(f_ppp); destination(d_ppp); };
log { source(s_src); filter(f_news); filter(f_crit); destination(d_newscrit); };
log { source(s_src); filter(f_news); filter(f_err); destination(d_newserr); };
log { source(s_src); filter(f_news); filter(f_notice); destination(d_newsnotice); };
log { source(s_src); filter(f_error); destination(d_error); };
### Системные
log { source(s_src); filter(f_console); destination(d_console_all); destination(d_xconsole); };
log { source(s_src); filter(f_crit); destination(d_console); };
Проверяем – запускаем с выводом и дебагом
sudo /usr/sbin/syslog-ng -Fvde
Если всё ок – стартуем syslog-ng, но только после того как настроим прием логов на сервере.
sudo /etc/init.d/syslog-ng start
Настраиваем syslog-ng сервер на прием логов nginx,php и nodejs через udp и отправку их в elasticsearch и postgresql. Так же настроим прием системных логов и отправку их в elasticsearch
Приведем syslog-ng к определенному виду. У нас на текущий момент версия 3.12
nano/etc/syslog-ng/syslog-ng.conf
@version: 3.12
@include "scl.conf"
@module mod-java
# Настраиваем глобальные параметры
options {
chain_hostnames(off);
log_fifo_size(1000000);
use_dns(no);
use_fqdn(no);
owner("root");
group("adm");
perm(0640);
stats_freq(0);
bad_hostname("^gconfd$");
};
@include "/etc/syslog-ng/conf.d/*.conf"
Так же как и на клиентах, все конфиги будем инклудить для удобства через conf.d.
Примечание. Также включаем прием по tcp – как показала практика, udp иногда падает – решения с форумов и от разработчиков не помогло.
nano /etc/syslog-ng/conf.d/input.conf
#####################################################################################################################
#####################################################################################################################
##Прием логов nginx access  с удаленных машин  на порт udp
source remote_log_host_nginx_access_udp  {
 udp(port(25214)so_rcvbuf(16777216) log_iw_size(10000) log_fetch_limit(1000000));
};
##Прием логов nginx access  с удаленных машин  на порт tcp
source remote_log_host_nginx_access_tcp {
 tcp(port(25214) so_rcvbuf(67108864) log_iw_size(100000)   log_fetch_limit(1000000) max-connections(200));
};
#####################################################################################################################
#####################################################################################################################
###Парсим логи nginx access по столбцам из csv
parser p_remote_log_host_nginx_access {
    csv-parser(columns("NGINX_TIME", "NGINX_http_host", "NGINX_remote_addr", "NGINX_http_x_forwarded_for", "NGINX_request", "NGINX_request_method","NGINX_status", "NGINX_body_bytes_sent", "NGINX_http_referer", "NGINX_request_time", "NGINX_upstream_http_x_cache", "NGINX_uri", "NGINX_upstream_addr", "NGINX_host", "NGINX_upstream_response_length", "NGINX_upstream_status", "NGINX_server_name", "NGINX_newurl", "NGINX_upstream_response_time", "NGINX_user_agent")
         flags(escape-double-char,strip-whitespace)
         delimiters("|")
         quote-pairs('""[]')
         );
};
#####################################################################################################################
#####################################################################################################################
###Направляем nginx_acess в elasticsearch
destination d_elastic_nginx_access {
  elasticsearch2(
    #client-lib-dir("/usr/share/elasticsearch/lib/")
    index("nginxaccess-${YEAR}.${MONTH}.${DAY}")
    type("test")
    time-zone("UTC")
    client_mode("http")
    flush-limit("10000")
    cluster_url("http://elasticnode1:9200")
    custom_id("${UNIQID}")
    template("$(format_json --scope nv_pairs --key ISODATE @timestamp=${ISODATE})")
  );
};
#Направляем в postgres
destination d_postgres_nginx_access {
  sql(type(pgsql)
  host("elasticnode1")  port("15432") username("postgres") password("mysecretpassword")
  database("nginx_access")
  table("DATE_${R_YEAR}_${R_MONTH}_nginx_access")
  columns("HOST text", "NGINX_TIME text", "NGINX_http_host text", "NGINX_remote_addr text", "NGINX_http_x_forwarded_for text", "NGINX_request_method text", "NGINX_request text", "NGINX_status text",  "NGINX_body_bytes_sent text",  "NGINX_http_referer text", "NGINX_request_time text", "NGINX_upstream_http_x_cache text", "NGINX_uri text", "NGINX_upstream_addr text",  "NGINX_host  text", "NGINX_upstream_response_length text", "NGINX_upstream_status text", "NGINX_server_name text", "NGINX_newurl text", "NGINX_upstream_response_time text", "NGINX_user_agent text")
  values("$HOST", "${NGINX_TIME}", "${NGINX_http_host}", "${NGINX_remote_addr}", "${NGINX_http_x_forwarded_for}", "${NGINX_request_method}", "${NGINX_request}", "${NGINX_status}", "${NGINX_body_bytes_sent}", "${NGINX_http_referer}", "${NGINX_request_time}", "${NGINX_upstream_http_x_cache}", "${NGINX_uri}", "${NGINX_upstream_addr}", "${NGINX_host }", "${NGINX_upstream_response_length}", "${NGINX_upstream_status}", "${NGINX_server_name}", "${NGINX_newurl}", "${NGINX_upstream_response_time}", "${NGINX_user_agent}")
  indexes("NGINX_server_name", "NGINX_newurl"));
};
#####Логи nginx access через tcp
#log {source(remote_log_host_nginx_access_tcp);  parser(p_remote_log_host_nginx_access); destination(d_elastic_nginx_access); };
log {source(remote_log_host_nginx_access_udp);  parser(p_remote_log_host_nginx_access); destination(d_elastic_nginx_access); };
log {source(remote_log_host_nginx_access);  parser(p_remote_log_host_nginx_access); destination(d_postgres_nginx_access); };
##Прием логов nginx error  с удаленных машин  на порт udp
source remote_log_host_nginx_error_udp  {
 udp(port(25215)so_rcvbuf(16777216) log_iw_size(10000) log_fetch_limit(1000000));
};
##Прием логов nginx error  с удаленных машин  на порт tcp
source remote_log_host_nginx_error_tcp {
 tcp(port(25215) so_rcvbuf(67108864) log_iw_size(100000)   log_fetch_limit(1000000) max-connections(200));
};
 ###Направляем nginx_error  в elasticsearch
destination d_elastic_nginx_error {
  elasticsearch2(
    #client-lib-dir("/usr/share/elasticsearch/lib/")
    index("nginxerror-${YEAR}.${MONTH}.${DAY}")
    type("test")
    time-zone("UTC")
    client_mode("http")
    flush-limit("10000")
    cluster_url("http://elasticnode1:9200")
    custom_id("${UNIQID}")
    template("$(format_json --scope nv_pairs --key ISODATE @timestamp=${ISODATE})")
  );
};
log {source(remote_log_host_nginx_error_udp); destination(d_elastic_nginx_error); };
#log {source(remote_log_host_nginx_error_tcp); destination(d_elastic_nginx_error); };
##Прием логов nodejs  с удаленных машин  на порт на порт udp
source remote_log_host_nodejs_udp {
 udp(port(25216) so_rcvbuf(16777216) log_iw_size(10000) log_fetch_limit(1000000));
};
##Прием логов nodejs  с удаленных машин  на порт на порт tcp
source remote_log_host_nodejs_tcp {
 tcp(port(25216) so_rcvbuf(67108864) log_iw_size(100000)   log_fetch_limit(1000000) max-connections(200));
};
 ###Направляем nodejs логи  в elasticsearch
destination d_elastic_nodejs {
  elasticsearch2(
    #client-lib-dir("/usr/share/elasticsearch/lib/")
    index("nodejs-${YEAR}.${MONTH}.${DAY}")
    type("test")
    time-zone("UTC")
    client_mode("http")
    flush-limit("10000")
    cluster_url("http://elasticnode1:9200")
    custom_id("${UNIQID}")
    template("$(format_json --scope nv_pairs --key ISODATE @timestamp=${ISODATE})")
  );
};
log {source(remote_log_host_nodejs_udp); destination(d_elastic_nodejs); };
#log {source(remote_log_host_nodejs_tcp); destination(d_elastic_nodejs); };
source udp_remote_log_host_nginx_main {
 udp(port(25230) log_iw_size(1000) log_fetch_limit(1000000)) ;
};
#source tcp_remote_log_host_nginx_main   {
 #tcp(port(25230) so_rcvbuf(67108864) log_iw_size(100000)   log_fetch_limit(1000000) max-connections(100)) ;
#};
###Парсим логи nginx access по столбцам  - разделитель "|"
#  log_format full_format '"$time_iso8601"|"$http_host"|"$remote_addr"|"$http_x_forwarded_for"|"$request_method"|"$request"|"$status"|"$body_bytes_sent"|"$http_referer"|"$request_time"|"$upstream_http_x_cache"|"$uri"|"$upstream_addr"|"$host"|"$upstream_response_length"|"$upstream_status"|"$server_name"|"$http_host"|"$upstream_response_time"|"$upstream_cache_status"|"$http_user_agent"|"$geoip_city"|"$geoip_country_name"|"$geoip_region"|"$http_cookie"';
parser p_remote_log_host_nginxaccessfull  {
    csv-parser(columns("NGINX_TIME", "NGINX_http_host", "NGINX_remote_addr", "NGINX_http_x_forwarded_for", "NGINX_request", "NGINX_request_method","NGINX_status", "NGINX_body_bytes_sent", "NGINX_http_referer", "NGINX_request_time", "NGINX_upstream_http_x_cache", "NGINX_uri", "NGINX_upstream_addr", "NGINX_host", "NGINX_upstream_response_length", "NGINX_upstream_status", "NGINX_server_name", "NGINX_newurl", "NGINX_upstream_response_time", "NGINX_upstream_cache_status", "NGINX_user_agent" , "geoip.city_name", "geoip.country_name", "geoip.region_name", "http_cookie" )
         flags(escape-double-char,strip-whitespace)
         delimiters("|")
         quote-pairs('""[]')
         );
};
###Направляем nginx_acess в elasticsearch
destination d_elastic_nginxaccessfull {
  elasticsearch2(
    #client-lib-dir("/usr/share/elasticsearch/lib/")
    index("nginxaccessfull-${YEAR}.${MONTH}.${DAY}")
    type("test")
    time-zone("UTC")
    client_mode("http")
    flush-limit("10000")
    cluster_url("http://elasticnode1:9200")
    custom_id("${UNIQID}")
    template("$(format_json --scope nv_pairs --key ISODATE @timestamp=${ISODATE})")
  );
};
log {source (udp_remote_log_host_nginx_main); parser(p_remote_log_host_nginxaccessfull );destination(d_elastic_nginxaccessfull);};
Здесь мы настроили парсинг входящего лога nginx acceess для отпраки его в elasticsearch и postgres, а также прием логов nginx error и nodejs и отправку их в elasticsearch.
Настраиваем прием системных логов c удаленных хостов через syslog-ng.
nano /etc/syslog-ng/conf.d/input.system.logs.conf
Вставляем содержимое
########################
# auth logs
########################
source tcp_remote_log_auth {
tcp(port(40514) so_rcvbuf(67108864) log_iw_size(100000)   log_fetch_limit(1000000) max-connections(200)); };
source udp_remote_log_auth {
udp(port(40514) log_iw_size(1000) log_fetch_limit(1000000));};
#parser p_geoip { geoip( "${HOST}", prefix( "geoip." ) database( "/etc/syslog-ng/GEOIP/GeoLiteCity.dat" ) ); };
###Направляем  в elasticsearch
destination d_elastic_auth {
  elasticsearch2(
    #client-lib-dir("/usr/share/elasticsearch/lib/")
    index("auth-${YEAR}.${MONTH}.${DAY}")
    type("test")
    time-zone("UTC")
    client_mode("http")
    flush-limit("10000")
    cluster_url("http://elasticnode1:9200")
    custom_id("${UNIQID}")
    template("$(format_json --scope nv_pairs --key ISODATE @timestamp=${ISODATE})")
  );
};
log { source(udp_remote_log_auth); destination(d_elastic_auth); };
########################
# crons logs
########################
source tcp_remote_log_host_crons  {
tcp(port(40515) so_rcvbuf(67108864) log_iw_size(100000)   log_fetch_limit(1000000) max-connections(200)); };
source udp_remote_log_host_crons  {
udp(port(40515) log_iw_size(1000) log_fetch_limit(1000000));};
###Направляем в elasticsearch
destination d_elastic_crons {
  elasticsearch2(
    #client-lib-dir("/usr/share/elasticsearch/lib/")
    index("crons-${YEAR}.${MONTH}.${DAY}")
    type("test")
    time-zone("UTC")
    client_mode("http")
    flush-limit("10000")
    cluster_url("http://elasticnode1:9200")
    custom_id("${UNIQID}")
    template("$(format_json --scope nv_pairs --key ISODATE @timestamp=${ISODATE})")
  );
};
log { source(udp_remote_log_host_crons); destination(d_elastic_crons); };
########################
# kern logs
########################
source tcp_remote_log_host_kern  {
tcp(port(40516) so_rcvbuf(67108864) log_iw_size(100000)   log_fetch_limit(1000000) max-connections(200)); };
source udp_remote_log_host_kern {
udp(port(40516) log_iw_size(1000) log_fetch_limit(1000000));};
###Направляем в elasticsearch
destination d_elastic_kern {
  elasticsearch2(
    #client-lib-dir("/usr/share/elasticsearch/lib/")
    index("kern-${YEAR}.${MONTH}.${DAY}")
    type("test")
    time-zone("UTC")
    client_mode("http")
    flush-limit("10000")
    cluster_url("http://elasticnode1:9200")
    custom_id("${UNIQID}")
    template("$(format_json --scope nv_pairs --key ISODATE @timestamp=${ISODATE})")
  );
};
log { source(udp_remote_log_host_kern ); destination(d_elastic_kern); };
########################
# daemon logs
########################
source tcp_remote_log_host_daemon {
tcp(port(40517) so_rcvbuf(67108864) log_iw_size(100000)   log_fetch_limit(1000000) max-connections(200)); };
source udp_remote_log_host_daemon {
udp(port(40517) log_iw_size(1000) log_fetch_limit(1000000));};
###Направляем в elasticsearch
destination d_elastic_daemon {
  elasticsearch2(
    #client-lib-dir("/usr/share/elasticsearch/lib/")
    index("daemon-${YEAR}.${MONTH}.${DAY}")
    type("test")
    time-zone("UTC")
    client_mode("http")
    flush-limit("10000")
    cluster_url("http://elasticnode1:9200")
    custom_id("${UNIQID}")
    template("$(format_json --scope nv_pairs --key ISODATE @timestamp=${ISODATE})")
  );
};
log { source(udp_remote_log_host_daemon); destination(d_elastic_daemon); };
########################
# user logs
########################
source tcp_remote_log_host_user  {
tcp(port(40518) so_rcvbuf(67108864) log_iw_size(100000)   log_fetch_limit(1000000) max-connections(200)); };
source udp_remote_log_host_user {
udp(port(40518) log_iw_size(1000) log_fetch_limit(1000000));};
###Направляем в elasticsearch
destination d_elastic_user {
  elasticsearch2(
    #client-lib-dir("/usr/share/elasticsearch/lib/")
    index("user-${YEAR}.${MONTH}.${DAY}")
    type("test")
    time-zone("UTC")
    client_mode("http")
    flush-limit("10000")
    cluster_url("http://elasticnode1:9200")
    custom_id("${UNIQID}")
    template("$(format_json --scope nv_pairs --key ISODATE @timestamp=${ISODATE})")
  );
};
log { source(udp_remote_log_host_user); destination(d_elastic_user); };
########################
# lpr logs
########################
source tcp_remote_log_host_lpr  {
tcp(port(40519) so_rcvbuf(67108864) log_iw_size(100000)   log_fetch_limit(1000000) max-connections(200)); };
source udp_remote_log_host_lpr {
udp(port(40519) log_iw_size(1000) log_fetch_limit(1000000));};
###Направляем в elasticsearch
destination d_elastic_lpr {
  elasticsearch2(
    #client-lib-dir("/usr/share/elasticsearch/lib/")
    index("lpr-${YEAR}.${MONTH}.${DAY}")
    type("test")
    time-zone("UTC")
    client_mode("http")
    flush-limit("10000")
    cluster_url("http://elasticnode1:9200")
    custom_id("${UNIQID}")
    template("$(format_json --scope nv_pairs --key ISODATE @timestamp=${ISODATE})")
  );
};
log { source(udp_remote_log_host_lpr); destination(d_elastic_lpr); };
########################
# syslog logs
########################
source tcp_remote_log_host_syslog  {
tcp(port(40520) so_rcvbuf(67108864) log_iw_size(100000)   log_fetch_limit(1000000) max-connections(200)); };
source udp_remote_log_host_syslog {
udp(port(40520) log_iw_size(1000) log_fetch_limit(1000000));};
###Направляем в elasticsearch
destination d_elastic_syslog {
  elasticsearch2(
    #client-lib-dir("/usr/share/elasticsearch/lib/")
    index("syslog-${YEAR}.${MONTH}.${DAY}")
    type("test")
    time-zone("UTC")
    client_mode("http")
    flush-limit("10000")
    cluster_url("http://elasticnode1:9200")
    custom_id("${UNIQID}")
    template("$(format_json --scope nv_pairs --key ISODATE @timestamp=${ISODATE})")
  );
};
log { source(udp_remote_log_host_syslog); destination(d_elastic_syslog); };
########################
# uucp logs
########################
source tcp_remote_log_host_uucp  {
tcp(port(40521) so_rcvbuf(67108864) log_iw_size(100000)   log_fetch_limit(1000000) max-connections(200)); };
source udp_remote_log_host_uucp {
udp(port(40521) log_iw_size(1000) log_fetch_limit(1000000));};
###Направляем в elasticsearch
destination d_elastic_uucp {
  elasticsearch2(
    #client-lib-dir("/usr/share/elasticsearch/lib/")
    index("uucp-${YEAR}.${MONTH}.${DAY}")
    type("test")
    time-zone("UTC")
    client_mode("http")
    flush-limit("10000")
    cluster_url("http://elasticnode1:9200")
    custom_id("${UNIQID}")
    template("$(format_json --scope nv_pairs --key ISODATE @timestamp=${ISODATE})")
  );
};
log { source(udp_remote_log_host_uucp); destination(d_elastic_uucp); };
########################
# mail logs
########################
source tcp_remote_log_host_mail {
tcp(port(40522) so_rcvbuf(67108864) log_iw_size(100000)   log_fetch_limit(1000000) max-connections(200)); };
source udp_remote_log_host_mail {
udp(port(40522) log_iw_size(1000) log_fetch_limit(1000000));};
###Направляем в elasticsearch
destination d_elastic_mail {
  elasticsearch2(
    #client-lib-dir("/usr/share/elasticsearch/lib/")
    index("mail-${YEAR}.${MONTH}.${DAY}")
    type("test")
    time-zone("UTC")
    client_mode("http")
    flush-limit("10000")
    cluster_url("http://elasticnode1:9200")
    custom_id("${UNIQID}")
    template("$(format_json --scope nv_pairs --key ISODATE @timestamp=${ISODATE})")
  );
};
log { source(udp_remote_log_host_mail); destination(d_elastic_mail); };
########################
# messages logs
########################
source tcp_remote_log_host_messages  {
tcp(port(40523) so_rcvbuf(67108864) log_iw_size(100000)   log_fetch_limit(1000000) max-connections(200)); };
source udp_remote_log_host_messages {
udp(port(40523) log_iw_size(1000) log_fetch_limit(1000000));};
###Направляем в elasticsearch
destination d_elastic_messages {
  elasticsearch2(
    #client-lib-dir("/usr/share/elasticsearch/lib/")
    index("messages-${YEAR}.${MONTH}.${DAY}")
    type("test")
    time-zone("UTC")
    client_mode("http")
    flush-limit("10000")
    cluster_url("http://elasticnode1:9200")
    custom_id("${UNIQID}")
    template("$(format_json --scope nv_pairs --key ISODATE @timestamp=${ISODATE})")
  );
};
log { source(udp_remote_log_host_messages); destination(d_elastic_messages); };
########################
# debug logs
########################
source tcp_remote_log_host_debug  {
tcp(port(40524) so_rcvbuf(67108864) log_iw_size(100000)   log_fetch_limit(1000000) max-connections(200)); };
source udp_remote_log_host_debug {
udp(port(40524) log_iw_size(1000) log_fetch_limit(1000000));};
###Направляем в elasticsearch
destination d_elastic_debug {
  elasticsearch2(
    #client-lib-dir("/usr/share/elasticsearch/lib/")
    index("debug-${YEAR}.${MONTH}.${DAY}")
    type("test")
    time-zone("UTC")
    client_mode("http")
    flush-limit("10000")
    cluster_url("http://elasticnode1:9200")
    custom_id("${UNIQID}")
    template("$(format_json --scope nv_pairs --key ISODATE @timestamp=${ISODATE})")
  );
};
log { source(udp_remote_log_host_debug); destination(d_elastic_debug); };
########################
# error logs
########################
source tcp_remote_log_host_error  {
tcp(port(40525) so_rcvbuf(67108864) log_iw_size(100000)   log_fetch_limit(1000000) max-connections(200)); };
source udp_remote_log_host_error {
udp(port(40525) log_iw_size(1000) log_fetch_limit(1000000));};
###Направляем в elasticsearch
destination d_elastic_error {
  elasticsearch2(
    #client-lib-dir("/usr/share/elasticsearch/lib/")
    index("error-${YEAR}.${MONTH}.${DAY}")
    type("test")
    time-zone("UTC")
    client_mode("http")
    flush-limit("10000")
    cluster_url("http://elasticnode1:9200")
    custom_id("${UNIQID}")
    template("$(format_json --scope nv_pairs --key ISODATE @timestamp=${ISODATE})")
  );
};
log { source(udp_remote_log_host_error); destination(d_elastic_error); };
Индексы созданные в elasticsearch соответственно буду иметь следующие названия:
nginxaccess-*
nginxerror-*
nodejs-*
И т.д.- смотрим на имена индексов.
Чтобы логи писались в postgresql создадим базу nginx_access на любой ноде и настроим подключения по вашим данным
su postgres -c "psql"
create database nginx_access;
В ней будут создаваться таблицы вида

Все рестартуем агенты на сервере и отправителе.
sudo /etc/init.d/syslog-ng restart
Заходим в kibana на
https://127.0.0.1:5601
Добавляем индекс
lasticsearch-*
В поле timestamp выбираем
@timestamp

Смотрим в discover наши логи
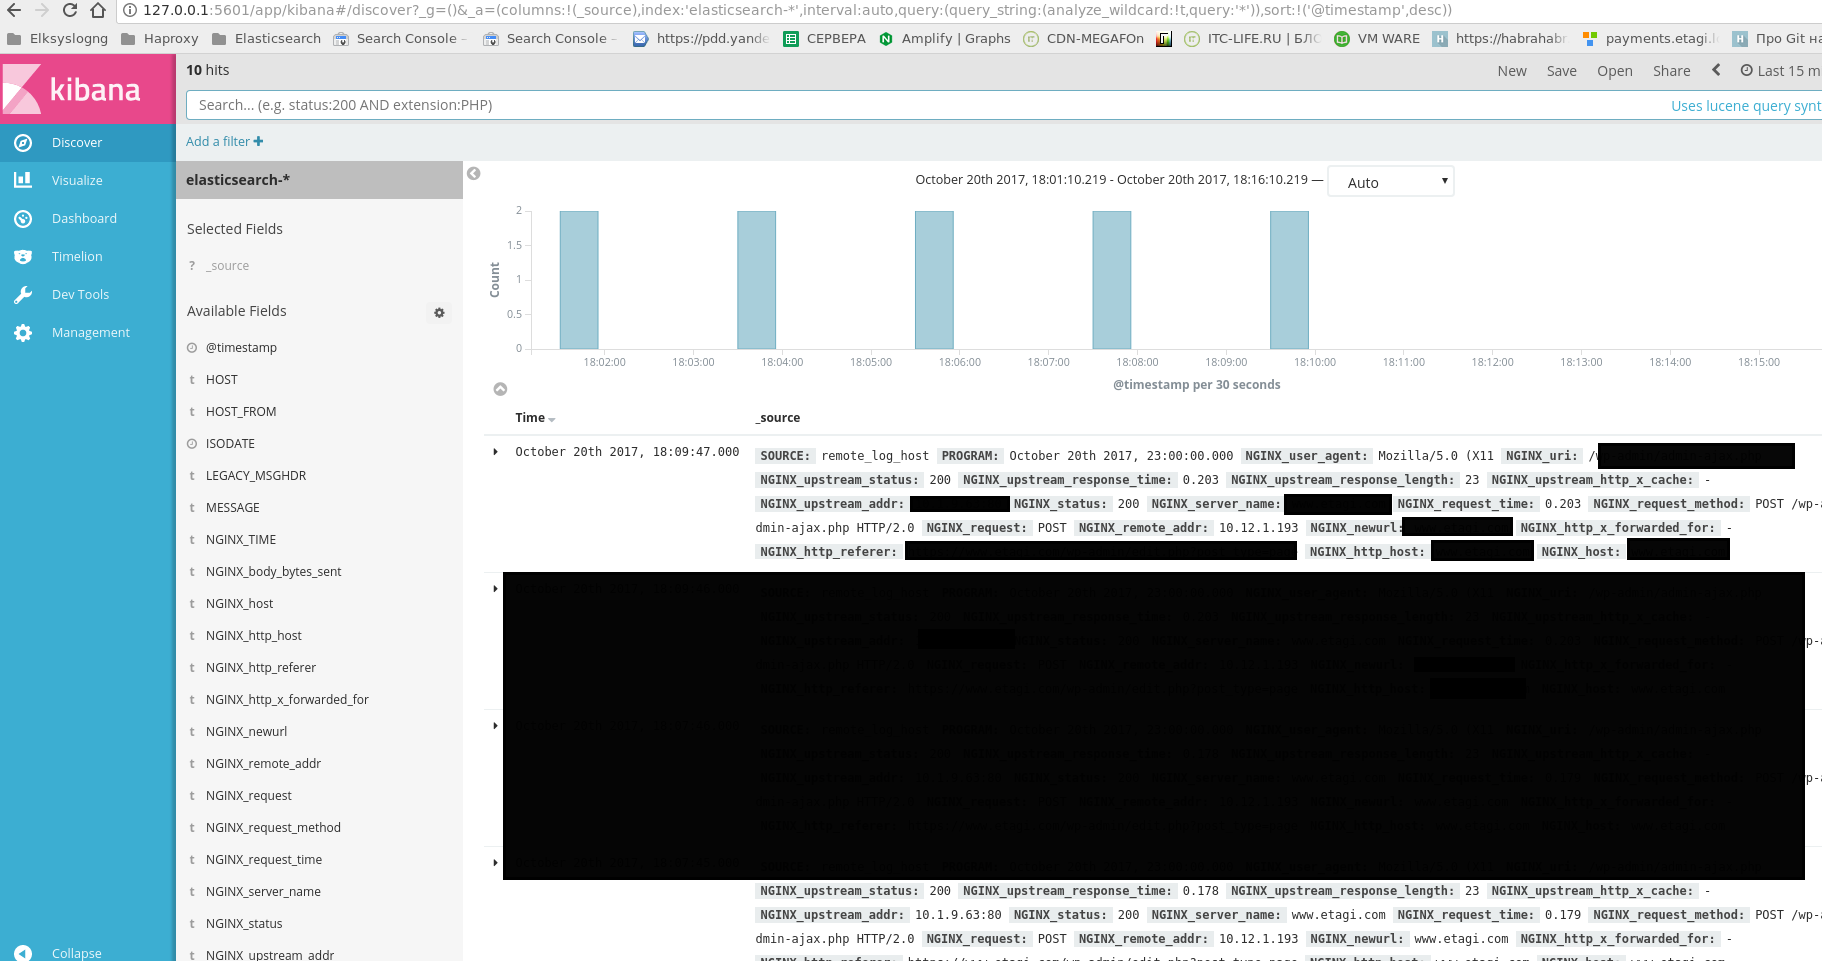
Все разложено как и надо по парам!!!
Теперь перейдем к постройке графиков, например по статусам nginx. У нас передается поле с именем
3. Различные сниппеты по логам
3.1 Обработчик лога – сырого формата json
source s_tcp_json { tcp(port(10514) flags(no-parse)); };
parser p_json { json-parser(prefix(“.json.”)); };
destination d_file { file(“/var/log/remote.log”
template(“${.json.timestamp} ${.json.source} ${.json.app}[${.json.id}]: ${.json.msg}\n”)); };
destination d_mongodb { mongodb(collection(“remote_log”)
value-pairs(
pair(“PROGRAM” “${.json.app}”)
pair(“HOST” “${.json.source}”)
pair(“PID” “${.json.id}”)
pair(“MESSAGE” “${.json.msg}”)
pair(“DATE” “${.json.timestamp}”)
pair(“PRIORITY” “${.json.prio}”)
pair(“FACILITY” “auth”)
)); };
log {
source(s_tcp_json);
parser(p_json);
destination(d_file);
destination(d_mongodb);
};
3.2 Обработчик лога – syslog над json
source s_tcp_json_payload { tcp(); };
parser p_json { json-parser(); };
destination d_file { file("/var/log/remote.log"); };
destination d_mongodb { mongodb(collection("remote_log")); };
log {
 source(s_tcp_json_payload);
 parser(p_json);
 destination(d_file);
 destination(d_mongodb);
};
3.3 Обработчик лога – mixed syslog json
block parser mixed-json-parser() {
 channel {
  junction {
   channel {
    parser { json-parser(marker("@json:")); };
    rewrite { set-tag(".json"); };
    flags(final);
   };
   channel {
    flags(final);
   };
  };
 };
};
source s_mixed {
 tcp();
 parser { mixed-json-parser(); };
};
3.4 Скрипт очистки логов nginx чтобы не засирать систему.
#!/bin/bash
echo "Вычищаю логи nginx"
rm -rf /var/log/nginx/*
/bin/sleep 1;
echo "Переинициализация логов nginx"
[ ! -f /var/run/nginx.pid ] || /bin/kill -USR1 `/bin/cat /var/run/nginx.pid`
echo "Смотрим процессы"
/bin/ps aux | grep nginx
/bin/ps aux | grep syslog-ng
Добавляем его по крону каждые 2 часа
3.5 Обработчик лога – mapping geoip в elasticsearch для визуализации mapheat
curl -X PUT "http://127.0.0.1:9200/nginx-access4/" -d '{
   "mappings" : {
      "_default_" : {
         "properties" : {
            "geoip" : {
               "properties" : {
                  "geoip.country.code" : {
                     "index" : "not_analyzed",
                     "type" : "string",
                     "doc_values" : true
                  },
                  "geoip.latitude" : {
                     "index" : "not_analyzed",
                     "type" : "string",
                     "doc_values" : true
                  },
                  "geoip.longitude" : {
                     "type" : "string",
                     "doc_values" : true,
                     "index" : "not_analyzed"
                  },
                  "location" : {
                     "type" : "geo_point"
                  }
               }
            }
         }
      }
   }
}';
где
$ES_HOST – elastic host
$INDEX– имя индекса
4. Исправление ошибок
High disk watermark [90%] exceeded on
Ошибка связана с исчерпанием ресурса диска – решается уменьшением минимального размера доступного места
curl -XPUT http://elasticnodehost:9200/_cluster/settings -d '{
  "transient": {
    "cluster.routing.allocation.disk.watermark.low": "99%",
    "cluster.routing.allocation.disk.watermark.high": "10gb",
    "cluster.info.update.interval": "1m"
  }
}'
Фикс ошибки Kibana
Courier Fetch: 5 of 10 shards failed.
Одним из вариантов решения является обновление полей индекса в elasticsearch

Фикс ошибки при запуске syslog-ng
Error parsing destination, destination plugin java not found in destination block elasticsearch2
Решение
export LD_LIBRARY_PATH=/usr/lib/jvm/java-8-openjdk-amd64/jre/lib/amd64/server:$LD_LIBRARY_PATH
5. Syslog-ng module incubator
Syslog-ng module incubator представляет собой набор инструментов и модулей для syslog-ng, которые по той или иной причине не являются частью официального репозитория. Syslog-ng module incubator служит как в качестве промежуточной площадки для экспериментальных модулей, так и в качестве хранилища плагинов.
Установка Syslog-ng module incubator
Требуемые зависимости
syslog-ng, bison, flex, libmongo-client, lua, perl, rdkafka; of which the latter six
Установка
git clone https://github.com/balabit/syslog-ng-incubator.git
cd syslog-ng-incubator
autoreconf -i
./configure && make && sudo make install
После установки регистрируемся
syslog-ng --module-registry
Что мы интересного в данном складе модулей?
Парсеры
grok parser
parser p_grok {
  grok(
       pattern_directory("/etc/syslog-ng/grok.d")
       match("%{STRING:field}" tags("matched" "string") )
       match("%{NUMBER:field}" tags("matched" "number") )
  );
};
Syslog-ng journald send logs
source s_journald {
	systemd-journal(prefix(".SDATA.journald."));
};
destination d_network {
	syslog("server.host");
};
log {
	source(s_journald);
	destination(d_network);
};
Триггеры
source s_trigger {
 trigger(
  program-override("trigger")
  tags("trigger-happy")
  trigger-freq(5)
  trigger-message("Beep.")
 );
};
Дополнительная целевая база для отправки логов.
Riemann
destination d_riemann {
 riemann(
  ttl("120")
  description("syslog-ng internal errors")
  metric(int("${SEQNUM}"))
 );
};
log {
  source { internal(); };
  filter { level(err..emerg); };
  destination(d_riemann);
};
Rss канал
destination d_rss {
 rss(
  port(8192)
  feed-title("Critical errors in the system")
  entry-title("Error from ${PROGRAM} @ ${HOST_FROM} at ${ISODATE}")
  entry-description("${MESSAGE}")
 );
};
Мониторинг с помощью syslog-ng и lua скриптов
source s_mark {
  monitor (
     monitor-freq(5)  # 5 seconds period
     monitor-script("/etc/syslog-ng/mark.lua")
     monitor-func("mark")
  );
};
destination d_tcp {
   tcp("" port() );
};
log {
  source(s_mark);
  destination(d_tcp);
};
Скрипт /etc/syslog-ng/mark.lua
values = { "wait_for_run", "sleep", "swapped", "free", "buffers",
"cache", "swapped_in", "swapped_out", "io_in", "io_out", "interrupts",
            "context_switches", "user_time", "kernel_time", "idle",
"wait_for_io" }
-- source
function vmstat()
  local result = {}
  local f = assert(io.popen("vmstat -n 1 1 | tail -n 1", 'r'))
  line = f:read("*all")
  f:close()
  local i = 1
  local send = -1
  local sstart = 0
  while i < #values do
    sstart, send = line:find("[^%s]+", send + 1)
    result["vmstat."..values[i]] = line:sub(sstart, send)
    i = i + 1
  end
  return result
end
6. Запросы в kibana
Найти время ответа сервера в промежутке между 10 и 11 сек(длительность)
NGINX_request_time: ["10.000" TO "11.000"]
Syslog-ng alerts на события
Пример конфгига для alets. Отправка уведомления на почту
filter f_linkdown {
    match("eth0: link down" value("MESSAGE"));
};
destination d_alert {
    smtp(
        host("localhost") port(25)
        from("syslog-ng alert service" "syslog@localhost")
        reply-to("Admins" "root@localhost")
        to("Ennekem" "me@localhost")
        subject("[SYSLOG ALERT]: eth0 link down")
        body("Syslog received an alert:\n$MSG")
        );
};
log {
    source(s_local);
    filter(f_linkdown);
    destination(d_alert);
};