Меняем конфиги агентов отправки логов на удаленный сервер
sudo nano /etc/packetbeat/packetbeat.yml
interfaces:
  device: any
############################# Protocols #######################################
protocols:
  dns:
    # Configure the ports where to listen for DNS traffic. You can disable
    # the DNS protocol by commenting out the list of ports.
    ports: [53]
    # include_authorities controls whether or not the dns.authorities field
    # (authority resource records) is added to messages.
    # Default: false
    include_authorities: true
    include_additionals: true
  http:
    # Configure the ports where to listen for HTTP traffic. You can disable
    # the HTTP protocol by commenting out the list of ports.
    ports: [80, 8080, 8000, 5000, 8002, 443]
    # Uncomment the following to hide certain parameters in URL or forms attached
    # to HTTP requests. The names of the parameters are case insensitive.
    # The value of the parameters will be replaced with the 'xxxxx' string.
    # This is generally useful for avoiding storing user passwords or other
    # sensitive information.
    # Only query parameters and top level form parameters are replaced.
    # hide_keywords: ['pass', 'password', 'passwd']
  memcache:
    # Configure the ports where to listen for memcache traffic. You can disable
    # the Memcache protocol by commenting out the list of ports.
    ports: [11211]
    # Uncomment the parseunknown option to force the memcache text protocol parser
    # to accept unknown commands.
    # Note: All unknown commands MUST not contain any data parts!
    # Default: false
    # parseunknown: true
    # Update the maxvalue option to store the values - base64 encoded - in the
    # json output.
    # possible values:
    #    maxvalue: -1  # store all values (text based protocol multi-get)
    #    maxvalue: 0   # store no values at all
    #    maxvalue: N   # store up to N values
    # Default: 0
    # maxvalues: -1
    # Use maxbytespervalue to limit the number of bytes to be copied per value element.
    # Note: Values will be base64 encoded, so actual size in json document
    #       will be 4 times maxbytespervalue.
    # Default: unlimited
    # maxbytespervalue: 100
    # UDP transaction timeout in milliseconds.
    # Note: Quiet messages in UDP binary protocol will get response only in error case.
    #       The memcached analyzer will wait for udptransactiontimeout milliseconds
    #       before publishing quiet messages. Non quiet messages or quiet requests with
    #       error response will not have to wait for the timeout.
    # Default: 200
    # udptransactiontimeout: 1000
  mysql:
    # Configure the ports where to listen for MySQL traffic. You can disable
    # the MySQL protocol by commenting out the list of ports.
    ports: [3306]
  pgsql:
    # Configure the ports where to listen for Pgsql traffic. You can disable
    # the Pgsql protocol by commenting out the list of ports.
    ports: [5432]
  redis:
    # Configure the ports where to listen for Redis traffic. You can disable
    # the Redis protocol by commenting out the list of ports.
    ports: [6379]
  thrift:
    # Configure the ports where to listen for Thrift-RPC traffic. You can disable
    # the Thrift-RPC protocol by commenting out the list of ports.
    ports: [9090]
  mongodb:
    # Configure the ports where to listen for MongoDB traffic. You can disable
    # the MongoDB protocol by commenting out the list of ports.
    ports: [27017]
############################# Processes #######################################
# Configure the processes to be monitored and how to find them. If a process is
# monitored then Packetbeat attempts to use it's name to fill in the `proc` and
# `client_proc` fields.
# The processes can be found by searching their command line by a given string.
#
# Process matching is optional and can be enabled by uncommenting the following
# lines.
#
#procs:
#  enabled: false
#  monitored:
#    - process: mysqld
#      cmdline_grep: mysqld
#
#    - process: pgsql
#      cmdline_grep: postgres
#
#    - process: nginx
#      cmdline_grep: nginx
#
#    - process: app
#      cmdline_grep: gunicorn
###############################################################################
############################# Libbeat Config ##################################
# Base config file used by all other beats for using libbeat features
############################# Output ##########################################
# Configure what outputs to use when sending the data collected by the beat.
# Multiple outputs may be used.
output:
  logstash:
    hosts: ["10.12.1.72:5044"]
############################# Shipper #########################################
shipper:
############################# Logging #########################################
logging:
  files:
    # The directory where the log files will written to.
    #path: /var/log/mybeat
    # The name of the files where the logs are written to.
    #name: mybeat
    # Configure log file size limit. If limit is reached, log file will be
    # automatically rotated
    rotateeverybytes: 10485760 # = 10MB
    # Number of rotated log files to keep. Oldest files will be deleted first.
    #keepfiles: 7
  # Enable debug output for selected components. To enable all selectors use ["*"]
  # Other available selectors are beat, publish, service
  # Multiple selectors can be chained.
  #selectors: [ ]
  # Sets log level. The default log level is error.
  # Available log levels are: critical, error, warning, info, debug
  #level: error
metricbeat.config.modules:
  # Glob pattern for configuration reloading
  path: ${path.config}/conf.d/*.yml
  # Period on which files under path should be checked for chagnes
  reload.period: 10s
  # Set to true to enable config reloading
  reload.enabled: false
#==========================  Modules configuration ============================
metricbeat.modules:
#------------------------------- System Module -------------------------------
- module: system
  metricsets:
    # CPU stats
    - cpu
    # System Load stats
    - load
    # Per CPU core stats
    - core
    # IO stats
    - diskio
    # Per filesystem stats
    - filesystem
    # File system summary stats
    - fsstat
    # Memory stats
    - memory
    # Network stats
    - network
    # Per process stats
    - process
    # Sockets and connection info (linux only)
    #- socket
  enabled: true
  period: 10s
  processes: ['.*']
  # if true, exports the CPU usage in ticks, together with the percentage values
  #cpu_ticks: false
  # Enable collection of cgroup metrics from processes on Linux.
  #process.cgroups.enabled: true
  # A list of regular expressions used to whitelist environment variables
  # reported with the process metricset's events. Defaults to empty.
  #process.env.whitelist: []
  # Configure reverse DNS lookup on remote IP addresses in the socket metricset.
  #socket.reverse_lookup.enabled: false
  #socket.reverse_lookup.success_ttl: 60s
  #socket.reverse_lookup.failure_ttl: 60s
#------------------------------- Apache Module -------------------------------
#- module: apache
  #metricsets: ["status"]
  #enabled: true
  #period: 10s
  # Apache hosts
  #hosts: ["http://127.0.0.1"]
  # Path to server status. Default server-status
  #server_status_path: "server-status"
  # Username of hosts.  Empty by default
  #username: test
  # Password of hosts. Empty by default
  #password: test123
#-------------------------------- ceph Module --------------------------------
#- module: ceph
#  metricsets: ["cluster_disk", "cluster_health", "monitor_health", "pool_disk"]
#  enabled: true
#  period: 10s
#  hosts: ["localhost:5000"]
#------------------------------ Couchbase Module -----------------------------
#- module: couchbase
  #metricsets: ["cluster", "node", "bucket"]
  #enabled: true
  #period: 10s
  #hosts: ["localhost:8091"]
#------------------------------- Docker Module -------------------------------
#- module: docker
  #metricsets: ["container", "cpu", "diskio", "healthcheck", "info", "memory", "network"]
  #hosts: ["unix:///var/run/docker.sock"]
  #enabled: true
  #period: 10s
  # To connect to Docker over TLS you must specify a client and CA certificate.
  #ssl:
    #certificate_authority: "/etc/pki/root/ca.pem"
    #certificate:           "/etc/pki/client/cert.pem"
    #key:                   "/etc/pki/client/cert.key"
#------------------------------- HAProxy Module ------------------------------
#- module: haproxy
  #metricsets: ["info", "stat"]
  #enabled: true
  #period: 10s
  #hosts: ["tcp://127.0.0.1:14567"]
#------------------------------- Jolokia Module ------------------------------
#- module: jolokia
#  metricsets: ["jmx"]
#  enabled: true
#  period: 10s
#  hosts: ["localhost"]
#  namespace: "metrics"
#  path: "/jolokia/?ignoreErrors=true&canonicalNaming=false"
#  jmx.mapping:
#  jmx.application:
#  jmx.instance:
#-------------------------------- kafka Module -------------------------------
#- module: kafka
  #metricsets: ["partition"]
  #enabled: true
  #period: 10s
  #hosts: ["localhost:9092"]
  #client_id: metricbeat
  #retries: 3
  #backoff: 250ms
  # List of Topics to query metadata for. If empty, all topics will be queried.
  #topics: []
  # Optional SSL. By default is off.
  # List of root certificates for HTTPS server verifications
  #ssl.certificate_authorities: ["/etc/pki/root/ca.pem"]
  # Certificate for SSL client authentication
  #ssl.certificate: "/etc/pki/client/cert.pem"
  # Client Certificate Key
  #ssl.key: "/etc/pki/client/cert.key"
  # SASL authentication
  #username: ""
  #password: ""
#------------------------------- MongoDB Module ------------------------------
#- module: mongodb
  #metricsets: ["dbstats", "status"]
  #enabled: true
  #period: 10s
  # The hosts must be passed as MongoDB URLs in the format:
  # [mongodb://][user:pass@]host[:port].
  # The username and password can also be set using the respective configuration
  # options. The credentials in the URL take precedence over the username and
  # password configuration options.
  #hosts: ["localhost:27017"]
  # Username to use when connecting to MongoDB. Empty by default.
  #username: user
  # Password to use when connecting to MongoDB. Empty by default.
  #password: pass
#-------------------------------- MySQL Module -------------------------------
#- module: mysql
  #metricsets: ["status"]
  #enabled: true
  #period: 10s
  # Host DSN should be defined as "user:pass@tcp(127.0.0.1:3306)/"
  # The username and password can either be set in the DSN or using the username
  # and password config options. Those specified in the DSN take precedence.
  #hosts: ["root:secret@tcp(127.0.0.1:3306)/"]
  # Username of hosts. Empty by default.
  #username: root
  # Password of hosts. Empty by default.
  #password: secret
  # By setting raw to true, all raw fields from the status metricset will be added to the event.
  #raw: false
#-------------------------------- Nginx Module -------------------------------
#- module: nginx
  #metricsets: ["stubstatus"]
  #enabled: true
  #period: 10s
  # Nginx hosts
  #hosts: ["http://127.0.0.1"]
  # Path to server status. Default server-status
  #server_status_path: "server-status"
#------------------------------- php_fpm Module ------------------------------
#- module: php_fpm
  #metricsets: ["pool"]
  #enabled: true
  #period: 10s
  #status_path: "/status"
  #hosts: ["localhost:8080"]
#----------------------------- PostgreSQL Module -----------------------------
#- module: postgresql
  #metricsets:
    # Stats about every PostgreSQL database
    #- database
    # Stats about the background writer process's activity
    #- bgwriter
    # Stats about every PostgreSQL process
    #- activity
  #enabled: true
  #period: 10s
  # The host must be passed as PostgreSQL URL. Example:
  # postgres://localhost:5432?sslmode=disable
  # The available parameters are documented here:
  # https://godoc.org/github.com/lib/pq#hdr-Connection_String_Parameters
  #hosts: ["postgres://localhost:5432"]
  # Username to use when connecting to PostgreSQL. Empty by default.
  #username: user
  # Password to use when connecting to PostgreSQL. Empty by default.
  #password: pass
#----------------------------- Prometheus Module -----------------------------
#- module: prometheus
  #metricsets: ["stats"]
  #enabled: true
  #period: 10s
  #hosts: ["localhost:9090"]
  #metrics_path: /metrics
  #namespace: example
#-------------------------------- Redis Module -------------------------------
#- module: redis
  #metricsets: ["info", "keyspace"]
  #enabled: true
  #period: 10s
  # Redis hosts
  #hosts: ["127.0.0.1:6379"]
  # Timeout after which time a metricset should return an error
  # Timeout is by default defined as period, as a fetch of a metricset
  # should never take longer then period, as otherwise calls can pile up.
  #timeout: 1s
  # Optional fields to be added to each event
  #fields:
  #  datacenter: west
  # Network type to be used for redis connection. Default: tcp
  #network: tcp
  # Max number of concurrent connections. Default: 10
  #maxconn: 10
  # Filters can be used to reduce the number of fields sent.
  #filters:
  #  - include_fields:
  #      fields: ["stats"]
  # Redis AUTH password. Empty by default.
  #password: foobared
#------------------------------ ZooKeeper Module -----------------------------
#- module: zookeeper
  #metricsets: ["mntr"]
  #enabled: true
  #period: 10s
  #hosts: ["localhost:2181"]
#================================ General ======================================
# The name of the shipper that publishes the network data. It can be used to group
# all the transactions sent by a single shipper in the web interface.
# If this options is not defined, the hostname is used.
#name:
# The tags of the shipper are included in their own field with each
# transaction published. Tags make it easy to group servers by different
# logical properties.
#tags: ["service-X", "web-tier"]
# Optional fields that you can specify to add additional information to the
# output. Fields can be scalar values, arrays, dictionaries, or any nested
# combination of these.
#fields:
#  env: staging
# If this option is set to true, the custom fields are stored as top-level
# fields in the output document instead of being grouped under a fields
# sub-dictionary. Default is false.
#fields_under_root: false
# Internal queue size for single events in processing pipeline
#queue_size: 1000
# The internal queue size for bulk events in the processing pipeline.
# Do not modify this value.
#bulk_queue_size: 0
# Sets the maximum number of CPUs that can be executing simultaneously. The
# default is the number of logical CPUs available in the system.
#max_procs:
#================================ Processors ===================================
# Processors are used to reduce the number of fields in the exported event or to
# enhance the event with external metadata. This section defines a list of
# processors that are applied one by one and the first one receives the initial
# event:
#
#   event -> filter1 -> event1 -> filter2 ->event2 ...
#
# The supported processors are drop_fields, drop_event, include_fields, and
# add_cloud_metadata.
#
# For example, you can use the following processors to keep the fields that
# contain CPU load percentages, but remove the fields that contain CPU ticks
# values:
#
#processors:
#- include_fields:
#    fields: ["cpu"]
#- drop_fields:
#    fields: ["cpu.user", "cpu.system"]
#
# The following example drops the events that have the HTTP response code 200:
#
#processors:
#- drop_event:
#    when:
#       equals:
#           http.code: 200
#
# The following example enriches each event with metadata from the cloud
# provider about the host machine. It works on EC2, GCE, and DigitalOcean.
#
#processors:
#- add_cloud_metadata:
#
#================================ Outputs ======================================
# Configure what outputs to use when sending the data collected by the beat.
# Multiple outputs may be used.
#-------------------------- Elasticsearch output -------------------------------
#output.elasticsearch:
  # Boolean flag to enable or disable the output module.
  #enabled: true
  # Array of hosts to connect to.
  # Scheme and port can be left out and will be set to the default (http and 9200)
  # In case you specify and additional path, the scheme is required: http://localhost:9200/path
  # IPv6 addresses should always be defined as: https://[2001:db8::1]:9200
  #hosts: ["localhost:9200"]
  # Set gzip compression level.
  #compression_level: 0
  # Optional protocol and basic auth credentials.
  #protocol: "https"
  #username: "elastic"
  #password: "changeme"
  # Dictionary of HTTP parameters to pass within the url with index operations.
  #parameters:
    #param1: value1
    #param2: value2
  # Number of workers per Elasticsearch host.
  #worker: 1
  # Optional index name. The default is "metricbeat" plus date
  # and generates [metricbeat-]YYYY.MM.DD keys.
  #index: "metricbeat-%{+yyyy.MM.dd}"
  # Optional ingest node pipeline. By default no pipeline will be used.
  #pipeline: ""
  # Optional HTTP Path
  #path: "/elasticsearch"
  # Custom HTTP headers to add to each request
  #headers:
  #  X-My-Header: Contents of the header
  # Proxy server url
  #proxy_url: http://proxy:3128
  # The number of times a particular Elasticsearch index operation is attempted. If
  # the indexing operation doesn't succeed after this many retries, the events are
  # dropped. The default is 3.
  #max_retries: 3
  # The maximum number of events to bulk in a single Elasticsearch bulk API index request.
  # The default is 50.
  #bulk_max_size: 50
  # Configure http request timeout before failing an request to Elasticsearch.
  #timeout: 90
  # The number of seconds to wait for new events between two bulk API index requests.
  # If `bulk_max_size` is reached before this interval expires, addition bulk index
  # requests are made.
  #flush_interval: 1s
  # A template is used to set the mapping in Elasticsearch
  # By default template loading is enabled and the template is loaded.
  # These settings can be adjusted to load your own template or overwrite existing ones.
  # Set to false to disable template loading.
  #template.enabled: true
  # Template name. By default the template name is metricbeat.
  #template.name: "metricbeat"
  # Path to template file
  #template.path: "${path.config}/metricbeat.template.json"
  # Overwrite existing template
  #template.overwrite: false
  # If set to true, metricbeat checks the Elasticsearch version at connect time, and if it
  # is 2.x, it loads the file specified by the template.versions.2x.path setting. The
  # default is true.
  #template.versions.2x.enabled: true
  # Path to the Elasticsearch 2.x version of the template file.
  #template.versions.2x.path: "${path.config}/metricbeat.template-es2x.json"
  # If set to true, metricbeat checks the Elasticsearch version at connect time, and if it
  # is 6.x, it loads the file specified by the template.versions.6x.path setting. The
  # default is true.
  #template.versions.6x.enabled: true
  # Path to the Elasticsearch 6.x version of the template file.
  #template.versions.6x.path: "${path.config}/metricbeat.template-es6x.json"
  # Use SSL settings for HTTPS. Default is true.
  #ssl.enabled: true
  # Configure SSL verification mode. If `none` is configured, all server hosts
  # and certificates will be accepted. In this mode, SSL based connections are
  # susceptible to man-in-the-middle attacks. Use only for testing. Default is
  # `full`.
  #ssl.verification_mode: full
  # List of supported/valid TLS versions. By default all TLS versions 1.0 up to
  # 1.2 are enabled.
  #ssl.supported_protocols: [TLSv1.0, TLSv1.1, TLSv1.2]
  # SSL configuration. By default is off.
  # List of root certificates for HTTPS server verifications
  #ssl.certificate_authorities: ["/etc/pki/root/ca.pem"]
  # Certificate for SSL client authentication
  #ssl.certificate: "/etc/pki/client/cert.pem"
  # Client Certificate Key
  #ssl.key: "/etc/pki/client/cert.key"
  # Optional passphrase for decrypting the Certificate Key.
  #ssl.key_passphrase: ''
  # Configure cipher suites to be used for SSL connections
  #ssl.cipher_suites: []
  # Configure curve types for ECDHE based cipher suites
  #ssl.curve_types: []
#----------------------------- Logstash output ---------------------------------
output.logstash:
  # Boolean flag to enable or disable the output module.
  enabled: true
  # The Logstash hosts
  hosts: ["10.12.1.72:5044"]
  # Number of workers per Logstash host.
  #worker: 1
  # Set gzip compression level.
  #compression_level: 3
  # Optional load balance the events between the Logstash hosts
  #loadbalance: true
  # Number of batches to be send asynchronously to logstash while processing
  # new batches.
  #pipelining: 0
  # Optional index name. The default index name is set to name of the beat
  # in all lowercase.
  #index: 'metricbeat'
  # SOCKS5 proxy server URL
  #proxy_url: socks5://user:password@socks5-server:2233
  # Resolve names locally when using a proxy server. Defaults to false.
  #proxy_use_local_resolver: false
  # Enable SSL support. SSL is automatically enabled, if any SSL setting is set.
  #ssl.enabled: true
  # Configure SSL verification mode. If `none` is configured, all server hosts
  # and certificates will be accepted. In this mode, SSL based connections are
  # susceptible to man-in-the-middle attacks. Use only for testing. Default is
  # `full`.
  #ssl.verification_mode: full
  # List of supported/valid TLS versions. By default all TLS versions 1.0 up to
  # 1.2 are enabled.
  #ssl.supported_protocols: [TLSv1.0, TLSv1.1, TLSv1.2]
  # Optional SSL configuration options. SSL is off by default.
  # List of root certificates for HTTPS server verifications
  #ssl.certificate_authorities: ["/etc/pki/root/ca.pem"]
  # Certificate for SSL client authentication
  #ssl.certificate: "/etc/pki/client/cert.pem"
  # Client Certificate Key
  #ssl.key: "/etc/pki/client/cert.key"
  # Optional passphrase for decrypting the Certificate Key.
  #ssl.key_passphrase: ''
  # Configure cipher suites to be used for SSL connections
  #ssl.cipher_suites: []
  # Configure curve types for ECDHE based cipher suites
  #ssl.curve_types: []
#------------------------------- Kafka output ----------------------------------
#output.kafka:
  # Boolean flag to enable or disable the output module.
  #enabled: true
  # The list of Kafka broker addresses from where to fetch the cluster metadata.
  # The cluster metadata contain the actual Kafka brokers events are published
  # to.
  #hosts: ["localhost:9092"]
  # The Kafka topic used for produced events. The setting can be a format string
  # using any event field. To set the topic from document type use `%{[type]}`.
  #topic: beats
  # The Kafka event key setting. Use format string to create unique event key.
  # By default no event key will be generated.
  #key: ''
  # The Kafka event partitioning strategy. Default hashing strategy is `hash`
  # using the `output.kafka.key` setting or randomly distributes events if
  # `output.kafka.key` is not configured.
  #partition.hash:
    # If enabled, events will only be published to partitions with reachable
    # leaders. Default is false.
    #reachable_only: false
    # Configure alternative event field names used to compute the hash value.
    # If empty `output.kafka.key` setting will be used.
    # Default value is empty list.
    #hash: []
  # Authentication details. Password is required if username is set.
  #username: ''
  #password: ''
  # Kafka version metricbeat is assumed to run against. Defaults to the oldest
  # supported stable version (currently version 0.8.2.0)
  #version: 0.8.2
  # Metadata update configuration. Metadata do contain leader information
  # deciding which broker to use when publishing.
  #metadata:
    # Max metadata request retry attempts when cluster is in middle of leader
    # election. Defaults to 3 retries.
    #retry.max: 3
    # Waiting time between retries during leader elections. Default is 250ms.
    #retry.backoff: 250ms
    # Refresh metadata interval. Defaults to every 10 minutes.
    #refresh_frequency: 10m
  # The number of concurrent load-balanced Kafka output workers.
  #worker: 1
  # The number of times to retry publishing an event after a publishing failure.
  # After the specified number of retries, the events are typically dropped.
  # Some Beats, such as Filebeat, ignore the max_retries setting and retry until
  # all events are published.  Set max_retries to a value less than 0 to retry
  # until all events are published. The default is 3.
  #max_retries: 3
  # The maximum number of events to bulk in a single Kafka request. The default
  # is 2048.
  #bulk_max_size: 2048
  # The number of seconds to wait for responses from the Kafka brokers before
  # timing out. The default is 30s.
  #timeout: 30s
  # The maximum duration a broker will wait for number of required ACKs. The
  # default is 10s.
  #broker_timeout: 10s
  # The number of messages buffered for each Kafka broker. The default is 256.
  #channel_buffer_size: 256
  # The keep-alive period for an active network connection. If 0s, keep-alives
  # are disabled. The default is 0 seconds.
  #keep_alive: 0
  # Sets the output compression codec. Must be one of none, snappy and gzip. The
  # default is gzip.
  #compression: gzip
  # The maximum permitted size of JSON-encoded messages. Bigger messages will be
  # dropped. The default value is 1000000 (bytes). This value should be equal to
  # or less than the broker's message.max.bytes.
  #max_message_bytes: 1000000
  # The ACK reliability level required from broker. 0=no response, 1=wait for
  # local commit, -1=wait for all replicas to commit. The default is 1.  Note:
  # If set to 0, no ACKs are returned by Kafka. Messages might be lost silently
  # on error.
  #required_acks: 1
  # The number of seconds to wait for new events between two producer API calls.
  #flush_interval: 1s
  # The configurable ClientID used for logging, debugging, and auditing
  # purposes.  The default is "beats".
  #client_id: beats
  # Enable SSL support. SSL is automatically enabled, if any SSL setting is set.
  #ssl.enabled: true
  # Optional SSL configuration options. SSL is off by default.
  # List of root certificates for HTTPS server verifications
  #ssl.certificate_authorities: ["/etc/pki/root/ca.pem"]
  # Configure SSL verification mode. If `none` is configured, all server hosts
  # and certificates will be accepted. In this mode, SSL based connections are
  # susceptible to man-in-the-middle attacks. Use only for testing. Default is
  # `full`.
  #ssl.verification_mode: full
  # List of supported/valid TLS versions. By default all TLS versions 1.0 up to
  # 1.2 are enabled.
  #ssl.supported_protocols: [TLSv1.0, TLSv1.1, TLSv1.2]
  # Certificate for SSL client authentication
  #ssl.certificate: "/etc/pki/client/cert.pem"
  # Client Certificate Key
  #ssl.key: "/etc/pki/client/cert.key"
  # Optional passphrase for decrypting the Certificate Key.
  #ssl.key_passphrase: ''
  # Configure cipher suites to be used for SSL connections
  #ssl.cipher_suites: []
  # Configure curve types for ECDHE based cipher suites
  #ssl.curve_types: []
#------------------------------- Redis output ----------------------------------
#output.redis:
  # Boolean flag to enable or disable the output module.
  #enabled: true
  # The list of Redis servers to connect to. If load balancing is enabled, the
  # events are distributed to the servers in the list. If one server becomes
  # unreachable, the events are distributed to the reachable servers only.
  #hosts: ["localhost:6379"]
  # The Redis port to use if hosts does not contain a port number. The default
  # is 6379.
  #port: 6379
  # The name of the Redis list or channel the events are published to. The
  # default is metricbeat.
  #key: metricbeat
  # The password to authenticate with. The default is no authentication.
  #password:
  # The Redis database number where the events are published. The default is 0.
  #db: 0
  # The Redis data type to use for publishing events. If the data type is list,
  # the Redis RPUSH command is used. If the data type is channel, the Redis
  # PUBLISH command is used. The default value is list.
  #datatype: list
  # The number of workers to use for each host configured to publish events to
  # Redis. Use this setting along with the loadbalance option. For example, if
  # you have 2 hosts and 3 workers, in total 6 workers are started (3 for each
  # host).
  #worker: 1
  # If set to true and multiple hosts or workers are configured, the output
  # plugin load balances published events onto all Redis hosts. If set to false,
  # the output plugin sends all events to only one host (determined at random)
  # and will switch to another host if the currently selected one becomes
  # unreachable. The default value is true.
  #loadbalance: true
  # The Redis connection timeout in seconds. The default is 5 seconds.
  #timeout: 5s
  # The number of times to retry publishing an event after a publishing failure.
  # After the specified number of retries, the events are typically dropped.
  # Some Beats, such as Filebeat, ignore the max_retries setting and retry until
  # all events are published. Set max_retries to a value less than 0 to retry
  # until all events are published. The default is 3.
  #max_retries: 3
  # The maximum number of events to bulk in a single Redis request or pipeline.
  # The default is 2048.
  #bulk_max_size: 2048
  # The URL of the SOCKS5 proxy to use when connecting to the Redis servers. The
  # value must be a URL with a scheme of socks5://.
  #proxy_url:
  # This option determines whether Redis hostnames are resolved locally when
  # using a proxy. The default value is false, which means that name resolution
  # occurs on the proxy server.
  #proxy_use_local_resolver: false
  # Enable SSL support. SSL is automatically enabled, if any SSL setting is set.
  #ssl.enabled: true
  # Configure SSL verification mode. If `none` is configured, all server hosts
  # and certificates will be accepted. In this mode, SSL based connections are
  # susceptible to man-in-the-middle attacks. Use only for testing. Default is
  # `full`.
  #ssl.verification_mode: full
  # List of supported/valid TLS versions. By default all TLS versions 1.0 up to
  # 1.2 are enabled.
  #ssl.supported_protocols: [TLSv1.0, TLSv1.1, TLSv1.2]
  # Optional SSL configuration options. SSL is off by default.
  # List of root certificates for HTTPS server verifications
  #ssl.certificate_authorities: ["/etc/pki/root/ca.pem"]
  # Certificate for SSL client authentication
  #ssl.certificate: "/etc/pki/client/cert.pem"
  # Client Certificate Key
  #ssl.key: "/etc/pki/client/cert.key"
  # Optional passphrase for decrypting the Certificate Key.
  #ssl.key_passphrase: ''
  # Configure cipher suites to be used for SSL connections
  #ssl.cipher_suites: []
  # Configure curve types for ECDHE based cipher suites
  #ssl.curve_types: []
#------------------------------- File output -----------------------------------
#output.file:
  # Boolean flag to enable or disable the output module.
  #enabled: true
  # Path to the directory where to save the generated files. The option is
  # mandatory.
  #path: "/tmp/metricbeat"
  # Name of the generated files. The default is `metricbeat` and it generates
  # files: `metricbeat`, `metricbeat.1`, `metricbeat.2`, etc.
  #filename: metricbeat
  # Maximum size in kilobytes of each file. When this size is reached, and on
  # every metricbeat restart, the files are rotated. The default value is 10240
  # kB.
  #rotate_every_kb: 10000
  # Maximum number of files under path. When this number of files is reached,
  # the oldest file is deleted and the rest are shifted from last to first. The
  # default is 7 files.
  #number_of_files: 7
#----------------------------- Console output ---------------------------------
#output.console:
  # Boolean flag to enable or disable the output module.
  #enabled: true
  # Pretty print json event
  #pretty: false
#================================= Paths ======================================
# The home path for the metricbeat installation. This is the default base path
# for all other path settings and for miscellaneous files that come with the
# distribution (for example, the sample dashboards).
# If not set by a CLI flag or in the configuration file, the default for the
# home path is the location of the binary.
#path.home:
# The configuration path for the metricbeat installation. This is the default
# base path for configuration files, including the main YAML configuration file
# and the Elasticsearch template file. If not set by a CLI flag or in the
# configuration file, the default for the configuration path is the home path.
#path.config: ${path.home}
# The data path for the metricbeat installation. This is the default base path
# for all the files in which metricbeat needs to store its data. If not set by a
# CLI flag or in the configuration file, the default for the data path is a data
# subdirectory inside the home path.
#path.data: ${path.home}/data
# The logs path for a metricbeat installation. This is the default location for
# the Beat's log files. If not set by a CLI flag or in the configuration file,
# the default for the logs path is a logs subdirectory inside the home path.
#path.logs: ${path.home}/logs
#============================== Dashboards =====================================
# These settings control loading the sample dashboards to the Kibana index. Loading
# the dashboards is disabled by default and can be enabled either by setting the
# options here, or by using the `-setup` CLI flag.
#dashboards.enabled: false
# The URL from where to download the dashboards archive. By default this URL
# has a value which is computed based on the Beat name and version. For released
# versions, this URL points to the dashboard archive on the artifacts.elastic.co
# website.
#dashboards.url:
# The directory from where to read the dashboards. It is used instead of the URL
# when it has a value.
#dashboards.directory:
# The file archive (zip file) from where to read the dashboards. It is used instead
# of the URL when it has a value.
#dashboards.file:
# If this option is enabled, the snapshot URL is used instead of the default URL.
#dashboards.snapshot: false
# The URL from where to download the snapshot version of the dashboards. By default
# this has a value which is computed based on the Beat name and version.
#dashboards.snapshot_url
# In case the archive contains the dashboards from multiple Beats, this lets you
# select which one to load. You can load all the dashboards in the archive by
# setting this to the empty string.
#dashboards.beat: metricbeat
# The name of the Kibana index to use for setting the configuration. Default is ".kibana"
#dashboards.kibana_index: .kibana
# The Elasticsearch index name. This overwrites the index name defined in the
# dashboards and index pattern. Example: testbeat-*
#dashboards.index:
#================================ Logging ======================================
# There are three options for the log output: syslog, file, stderr.
# Under Windows systems, the log files are per default sent to the file output,
# under all other system per default to syslog.
# Sets log level. The default log level is info.
# Available log levels are: critical, error, warning, info, debug
#logging.level: info
# Enable debug output for selected components. To enable all selectors use ["*"]
# Other available selectors are "beat", "publish", "service"
# Multiple selectors can be chained.
#logging.selectors: [ ]
# Send all logging output to syslog. The default is false.
#logging.to_syslog: true
# If enabled, metricbeat periodically logs its internal metrics that have changed
# in the last period. For each metric that changed, the delta from the value at
# the beginning of the period is logged. Also, the total values for
# all non-zero internal metrics are logged on shutdown. The default is true.
#logging.metrics.enabled: true
# The period after which to log the internal metrics. The default is 30s.
#logging.metrics.period: 30s
# Logging to rotating files files. Set logging.to_files to false to disable logging to
# files.
logging.to_files: true
logging.files:
  # Configure the path where the logs are written. The default is the logs directory
  # under the home path (the binary location).
  #path: /var/log/metricbeat
  # The name of the files where the logs are written to.
  #name: metricbeat
  # Configure log file size limit. If limit is reached, log file will be
  # automatically rotated
  #rotateeverybytes: 10485760 # = 10MB
  # Number of rotated log files to keep. Oldest files will be deleted first.
  #keepfiles: 7
Перезапускаем сервисы
sudo /etc/init.d/filebeat start
sudo /etc/init.d/packetbeat start
sudo service metricbeat start
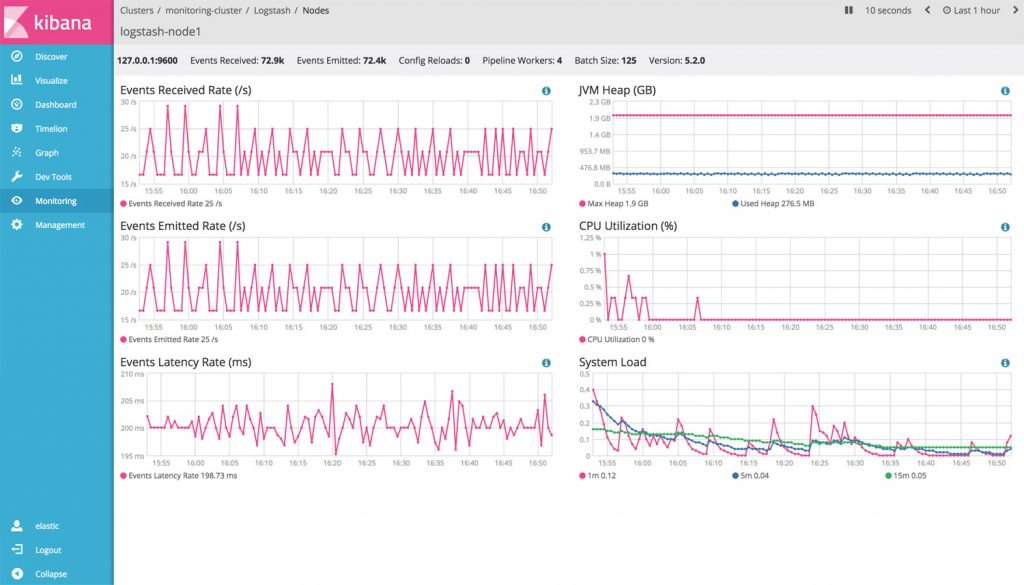
2.Настройка сервера сбора,обработки и отображения логов
server.port: 5601
# Specifies the address to which the Kibana server will bind. IP addresses and host names are both valid values.
# The default is 'localhost', which usually means remote machines will not be able to connect.
# To allow connections from remote users, set this parameter to a non-loopback address.
server.host: "10.12.1.72"
# Enables you to specify a path to mount Kibana at if you are running behind a proxy. This only affects
# the URLs generated by Kibana, your proxy is expected to remove the basePath value before forwarding requests
# to Kibana. This setting cannot end in a slash.
#server.basePath: ""
# The maximum payload size in bytes for incoming server requests.
#server.maxPayloadBytes: 1048576
# The Kibana server's name.  This is used for display purposes.
#server.name: "your-hostname"
# The URL of the Elasticsearch instance to use for all your queries.
elasticsearch.url: "http://localhost:9200"
Загружаем дашбоарды
curl -L -O http://download.elastic.co/beats/dashboards/beats-dashboards-1.3.1.zip
unzip beats-dashboards-1.3.1.zip
cd beats-dashboards-1.3.1/
./load.sh
Может понадобиться библиотека lib-pg Редактируем конфиг td-agent на клиенте
nano /etc/td-agent/td-agent.conf
  type forward
  port 29680


  type          pgjson
  host          localhost
  port          5432
  sslmode       prefer
  database      fluentd
  table         fluentd
  user          postgres
  password      postgres
  time_col      time
  tag_col       tag
  record_col    record
Стартуем td-agent
service td-agent start
Запрос на отбор долгих селектов postgres
select time, record#>>'{hostname}' as host, record#>>'{user_name}' as user, record#>>'{database_name}' as db, record#>>'{duration}' as duration, record#>>'{statement}' as statement from fluentd where tag = 'pgsql.slow_query' ORDER BY (record#>'{duration}') desc LIMIT 10;