
Пишем логи nginx, php, nodejs в базу postgres через syslog-ng напрямую в базу или через сервер логов
Установка syslog-ng
Удаляем rsyslog
sudo systemctl disable rsyslog
sudo systemctl stop rsyslog
Ставим необхдимые системные пакеты
apt-get install apt-transport-https -y
Ставим java на debian 8
apt-get update && apt-get install -t jessie-backports openjdk-8-jre-headless  -y
 apt-get install -t jessie-backports openjdk-8-jre-headless  -y
update-java-alternatives --set java-1.8.0-openjdk-amd64
Ставим java на ubuntu
sudo apt-get install openjdk-8-jre-headless -y
Устанавливаем переменную окружения
export LD_LIBRARY_PATH=/usr/lib/jvm/java-8-openjdk-amd64/jre/lib/amd64/server:$LD_LIBRARY_PATH
Ставим syslog-ng последней версии на debian 8
wget http://ftp.ru.debian.org/debian/pool/main/o/openssl/libssl1.0.0_1.0.1t-1+deb8u6_amd64.deb && dpkg -i libssl1.0.0_1.0.1t-1+deb8u6_amd64.deb
wget http://ftp.ru.debian.org/debian/pool/main/j/json-c/libjson-c2_0.11-4_amd64.deb && dpkg -i libjson-c2_0.11-4_amd64.deb
wget -qO - http://download.opensuse.org/repositories/home:/laszlo_budai:/syslog-ng/Debian_8.0/Release.key | sudo apt-key add -
echo "deb http://download.opensuse.org/repositories/home:/laszlo_budai:/syslog-ng/Debian_8.0 ./" >> /etc/apt/sources.list.d/syslog-ng-obs.list
apt-get update
apt-get install syslog-ng-core syslog-ng-mod-pgsql libdbd-pgsql syslog-ng-mod-elastic
Ставим syslog-ng последней версии на ubuntu 16.04
sudo su
wget http://nl.archive.ubuntu.com/ubuntu/pool/main/j/json-c/libjson-c3_0.12.1-1.1_amd64.deb && dpkg -i libjson-c3_0.12.1-1.1_amd64.de
wget -qO - http://download.opensuse.org/repositories/home:/laszlo_budai:/syslog-ng/Debian_8.0/Release.key | sudo apt-key add -
echo "deb http://download.opensuse.org/repositories/home:/laszlo_budai:/syslog-ng/xUbuntu_16.10 ./" >> /etc/apt/sources.list.d/syslog-ng-obs.list
apt-get update
apt-get install syslog-ng-core syslog-ng-mod-pgsql libdbd-pgsql syslog-ng-mod-elastic
Ставим последний elasticsearch и kibana
wget -qO - https://artifacts.elastic.co/GPG-KEY-elasticsearch | apt-key add -
echo "deb https://artifacts.elastic.co/packages/5.x/apt stable main" >> /etc/apt/sources.list.d/elastic-5.x.list
apt-get update &&  apt-get install elasticsearch kibana -y
настраиваем kibana и elasticsearch
Конфиг elasticsearch
nano /etc/elasticsearch/elasticsearch.yml
network.host: 0.0.0.0
http.port: 9200
xpack.security.enabled: false
xpack.security.audit.enabled: false
Конфиг kibana
nano /etc/kibana/kibana.yml
---
## Default Kibana configuration from kibana-docker.
## from https://github.com/elastic/kibana-docker/blob/master/build/kibana/config/kibana.yml
#
server.name: kibana.local
server.host: "0"
elasticsearch.url: http://elasticsearchhost:9200
## Disable X-Pack
## see https://www.elastic.co/guide/en/x-pack/current/xpack-settings.html
##     https://www.elastic.co/guide/en/x-pack/current/installing-xpack.html#xpack-enabling
xpack.security.enabled: false
xpack.security.enabled: false
xpack.monitoring.enabled: false
xpack.ml.enabled: false
xpack.graph.enabled: false
xpack.reporting.enabled: false
Рестартуес сервисы
/etc/init.d/elasticsearch restart
/etc/init.d/kibana restart
Подготовка формата логов nginx,php и nodejs
Настройка формата логов в nginx
log_format logtodb '$time_iso8601;$http_host;$remote_addr;$http_x_forwarded_for;$request_method;$request;$status;$body_bytes_sent;$http_referer;$request_time;$upstream_http_x_cache;$uri;$upstream_addr;$host;$upstream_response_length;$upstream_status;$server_name;$http_host;$upstream_response_time';
log_format log '$request_method $scheme://$http_host$request_uri $http_host';
access_log /var/log/nginx/access_logtodb.log logtodb;
error_log /var/log/nginx/error.log;
Настройка логов php – отправка их в nginxerror.log
Добаляем в конфиг
 catch_workers_output = yes
php_flag[display_errors] = on
php_admin_value[error_log] = /var/log/fpm-php.www.log
php_admin_flag[log_errors] = on
Настройка формата логов nodejs, запускаемой через pm2
Делаем запуск с такими параметрамиpm2 start server.js --merge-logs --log-type=json --log-date-format="YYYY-MM-DD HH:mm Z" -i 4 --watch --max-memory-restart 1200M
На этом подготовка формата логов окончена
Настройка отправки логов через syslog-ng в postgres
Создаем базу в pg
CREATE DATABASE site_parser;
Правим файл
nano/etc/syslog-ng/syslog-ng.conf
Первый пример когда вам необходимо писать небольшой лог, например чтобы знать какие страницы у вас вообще посещаются
###### Источник для лога
source nginx_access_cache { file( "/var/log/nginx/access-parse.log"
                    follow_freq(1)
                    flags(no-parse)
     );
};
###### парсим лог здесь csv
parser p_nginx_access_cache {
    csv-parser(
    columns("NGINX_GET", "NGINX_URL", "NGINX_URL2" "LAST_ANSWER")
    flags(escape-double-char,strip-whitespace)
    #flags(greedy)
    delimiters(";")
    quote-pairs('""[]')
    );
};
#Фильтры
#исключаем \.jpeg|\.jpg|\.png|\.js|\.css|\.php
filter f_parser_jpg { not match("jpg");  };
filter f_parser_jpeg { not match("jpeg");  };
filter f_parser_png { not match("png");  };
filter f_parser_js { not match("js");  };
filter f_parser_css { not match("css");  };
filter f_parser_php { not match("php");  };
filter f_parser_method{  match("GET"); };
##Куда пишем
destination d_postgres_remote {
  sql(type(pgsql)
  host("$POSTGRES_HOST")  port("5432") username("postgres") password("$PG_PASSWORD")
  database("site_logs")
  table("access_site_new")
  columns("get text", "store1 text", "store2 varchar(80)", "last_answer varchar(255)" )
  values("${NGINX_GET}", "${NGINX_URL}", "${NGINX_URL2}", "${LAST_ANSWER}")
  indexes("store1", "store2", "last_answer"));
  #unique ("store1"));
};
###Собственно сама строка по логу - лог,фильтр,парсер и куда пишем
log {source(nginx_access_cache);  filter(f_parser_method);filter(f_parser_jpg);filter (f_parser_jpeg);  filter (f_parser_png); filter (f_parser_js); filter (f_parser_css); filter (f_parser_php);  parser(p_nginx_access_cache); destination(d_postgres_remote); };
###sql инсерт на уникальность  Делаем запрос в бд - чтобы падали только уникальные логи
#CREATE
#OR REPLACE RULE access_site_new_rule_pkey AS ON INSERT TO access_site_new
#WHERE
  #(
    #EXISTS (
      #SELECT
        #1
      #FROM
        #access_site_new
      #WHERE
        #access_site_new.store1 = NEW .store1
    #)
  #) DO
    #INSTEAD NOTHING;
Далее часть конфига с отправкой полного формата логов nginx access, nginx error, nodejs. Таблички в базе создаеются по имени хоста,дате.
nano /etc/syslog-ng/syslog-ng.conf
#########################################################################
###### Парсим nginx access-log и отправляем в postgres##################
source nginx_acceess_log { file( "/var/log/nginx/access_logtodb.log"
                    follow_freq(1)
                    flags(no-parse)
     );
};
parser p_nginx_acceess_log {
    csv-parser(columns("NGINX_TIME", "NGINX_http_host", "NGINX_remote_addr", "NGINX_http_x_forwarded_for", "NGINX_request", "NGINX_request_method","NGINX_status", "NGINX_body_bytes_sent", "NGINX_http_referer", "NGINX_request_time", "NGINX_upstream_http_x_cache", "NGINX_uri", "NGINX_upstream_addr", "NGINX_host", "NGINX_upstream_response_length", "NGINX_upstream_status", "NGINX_server_name", "NGINX_$http_host", "NGINX_upstream_response_time")
         flags(escape-double-char,strip-whitespace)
         delimiters(";")
         quote-pairs('""[]')
         );
};
###Формат лога
#$time_iso8601;$http_host;$remote_addr;$http_x_forwarded_for;$request;$status;$body_bytes_sent;$http_referer;$request_time;$upstream_http_x_cache;$uri;$upstream_addr;$host;$upstream_response_length;$upstream_status;$server_name;$$http_host;$upstream_response_time
destination d_postgres_nginx_acceess_log{
  sql(type(pgsql)
  host("$POSTGRES_HOST")  port("5432") username("site_logs") password("$PG_PASSWORD")
  database("site_logs")
  table("${HOST}_${R_YEAR}${R_MONTH}${R_DAY}_nginx_acceess")
  columns("NGINX_TIME text", "NGINX_http_host text", "NGINX_remote_addr text", "NGINX_http_x_forwarded_for text", "NGINX_request_method text", "NGINX_request text", "NGINX_status varchar(3)",  "NGINX_body_bytes_sent text",  "NGINX_http_referer text", "NGINX_request_time text", "NGINX_upstream_http_x_cache text", "NGINX_uri text", "NGINX_upstream_addr text",  "NGINX_host  text", "NGINX_upstream_response_length text", "NGINX_upstream_status varchar(3)", "NGINX_server_name text", "NGINX_$http_host text", "NGINX_upstream_response_time text")
  values("${NGINX_TIME}", "${NGINX_http_host}", "${NGINX_remote_addr}", "${NGINX_http_x_forwarded_for}", "${NGINX_request_method}", "${NGINX_request}", "${NGINX_status}", "${NGINX_body_bytes_sent}", "${NGINX_http_referer}", "${NGINX_request_time}", "${NGINX_upstream_http_x_cache}", "${NGINX_uri}", "${NGINX_upstream_addr}", "${NGINX_host }", "${NGINX_upstream_response_length}", "${NGINX_upstream_status}", "${NGINX_server_name}", "${NGINX_$http_host}", "${NGINX_upstream_response_time}")
  indexes("NGINX_request", "NGINX_uri", "NGINX_server_name"));
};
log {source(nginx_acceess_log);  parser(p_nginx_acceess_log); destination(d_postgres_nginx_acceess_log); };
###########################################################################################################
####Nginx error log parsing
source s_tail_nginx_error  { file( "/var/log/nginx/error.log"
                    follow_freq(1)
                    flags(no-parse)
     );
};
destination d_file_nginx_error_log{
 sql(type(pgsql)
 host("$POSTGRES_HOST") port("5432") username("site_logs") password("$PG_PASSWORD")
 database("site_logs")
 table("${HOST}_${R_YEAR}${R_MONTH}${R_DAY}_nginx_error")
 columns("datetime varchar(16)", "host varchar(32)", "program varchar(20)", "pid varchar(10)", "message varchar(800)")
 values("$R_DATE", "$HOST", "$PROGRAM", "$PID", "$MSG")
 indexes("datetime", "host", "program", "pid", "message"));
 };
log { source(s_tail_nginx_error ); destination(d_file_nginx_error_log);
 };
###########################################################################################################
####node_error_log_parsing
source s_tail_node  { file( "/root/.pm2/logs/server-error.log"
                    follow_freq(1)
                    flags(no-parse)
     );
};
destination d_file_node_error{
 sql(type(pgsql)
 host("$POSTGRES_HOST") port("5432") username("site_logs") password("$PG_PASSWORD")
 database("site_logs")
 table("${HOST}_${R_YEAR}${R_MONTH}${R_DAY}_nodejs_error")
 columns("datetime varchar(16)", "host varchar(32)", "program varchar(20)", "pid varchar(10)", "message varchar(800)")
 values("$R_DATE", "$HOST", "$PROGRAM", "$PID", "$MSG")
 indexes("datetime", "host", "program", "pid", "message"));
 };
log { source(s_tail_node); destination(d_file_node_error);
 };
pm2 start server.js --merge-logs --log-type=json --log-date-format="YYYY-MM-DD HH:mm Z" -i 4 --watch --max-memory-restart 1200M
На этом подготовка формата логов окончена
Настройка отправки логов через syslog-ng в postgres
Создаем базу в pg
CREATE DATABASE site_parser;
Правим файл
nano/etc/syslog-ng/syslog-ng.conf
Первый пример когда вам необходимо писать небольшой лог, например чтобы знать какие страницы у вас вообще посещаются
###### Источник для лога
source nginx_access_cache { file( "/var/log/nginx/access-parse.log"
follow_freq(1)
flags(no-parse)
);
};
###### парсим лог здесь csv
parser p_nginx_access_cache {
csv-parser(
columns("NGINX_GET", "NGINX_URL", "NGINX_URL2" "LAST_ANSWER")
flags(escape-double-char,strip-whitespace)
#flags(greedy)
delimiters(";")
quote-pairs('""[]')
);
};
#Фильтры
#исключаем \.jpeg|\.jpg|\.png|\.js|\.css|\.php
filter f_parser_jpg { not match("jpg"); };
filter f_parser_jpeg { not match("jpeg"); };
filter f_parser_png { not match("png"); };
filter f_parser_js { not match("js"); };
filter f_parser_css { not match("css"); };
filter f_parser_php { not match("php"); };
filter f_parser_method{ match("GET"); };
##Куда пишем
destination d_postgres_remote {
sql(type(pgsql)
host("$POSTGRES_HOST") port("5432") username("postgres") password("$PG_PASSWORD")
database("site_logs")
table("access_site_new")
columns("get text", "store1 text", "store2 varchar(80)", "last_answer varchar(255)" )
values("${NGINX_GET}", "${NGINX_URL}", "${NGINX_URL2}", "${LAST_ANSWER}")
indexes("store1", "store2", "last_answer"));
#unique ("store1"));
};
###Собственно сама строка по логу - лог,фильтр,парсер и куда пишем
log {source(nginx_access_cache); filter(f_parser_method);filter(f_parser_jpg);filter (f_parser_jpeg); filter (f_parser_png); filter (f_parser_js); filter (f_parser_css); filter (f_parser_php); parser(p_nginx_access_cache); destination(d_postgres_remote); };
###sql инсерт на уникальность Делаем запрос в бд - чтобы падали только уникальные логи
#CREATE
#OR REPLACE RULE access_site_new_rule_pkey AS ON INSERT TO access_site_new
#WHERE
#(
#EXISTS (
#SELECT
#1
#FROM
#access_site_new
#WHERE
#access_site_new.store1 = NEW .store1
#)
#) DO
#INSTEAD NOTHING;
Далее часть конфига с отправкой полного формата логов nginx access, nginx error, nodejs. Таблички в базе создаеются по имени хоста,дате.
nano /etc/syslog-ng/syslog-ng.conf
#########################################################################
###### Парсим nginx access-log и отправляем в postgres##################
source nginx_acceess_log { file( "/var/log/nginx/access_logtodb.log"
follow_freq(1)
flags(no-parse)
);
};
parser p_nginx_acceess_log {
csv-parser(columns("NGINX_TIME", "NGINX_http_host", "NGINX_remote_addr", "NGINX_http_x_forwarded_for", "NGINX_request", "NGINX_request_method","NGINX_status", "NGINX_body_bytes_sent", "NGINX_http_referer", "NGINX_request_time", "NGINX_upstream_http_x_cache", "NGINX_uri", "NGINX_upstream_addr", "NGINX_host", "NGINX_upstream_response_length", "NGINX_upstream_status", "NGINX_server_name", "NGINX_$http_host", "NGINX_upstream_response_time")
flags(escape-double-char,strip-whitespace)
delimiters(";")
quote-pairs('""[]')
);
};
###Формат лога
#$time_iso8601;$http_host;$remote_addr;$http_x_forwarded_for;$request;$status;$body_bytes_sent;$http_referer;$request_time;$upstream_http_x_cache;$uri;$upstream_addr;$host;$upstream_response_length;$upstream_status;$server_name;$$http_host;$upstream_response_time
destination d_postgres_nginx_acceess_log{
sql(type(pgsql)
host("$POSTGRES_HOST") port("5432") username("site_logs") password("$PG_PASSWORD")
database("site_logs")
table("${HOST}_${R_YEAR}${R_MONTH}${R_DAY}_nginx_acceess")
columns("NGINX_TIME text", "NGINX_http_host text", "NGINX_remote_addr text", "NGINX_http_x_forwarded_for text", "NGINX_request_method text", "NGINX_request text", "NGINX_status varchar(3)", "NGINX_body_bytes_sent text", "NGINX_http_referer text", "NGINX_request_time text", "NGINX_upstream_http_x_cache text", "NGINX_uri text", "NGINX_upstream_addr text", "NGINX_host text", "NGINX_upstream_response_length text", "NGINX_upstream_status varchar(3)", "NGINX_server_name text", "NGINX_$http_host text", "NGINX_upstream_response_time text")
values("${NGINX_TIME}", "${NGINX_http_host}", "${NGINX_remote_addr}", "${NGINX_http_x_forwarded_for}", "${NGINX_request_method}", "${NGINX_request}", "${NGINX_status}", "${NGINX_body_bytes_sent}", "${NGINX_http_referer}", "${NGINX_request_time}", "${NGINX_upstream_http_x_cache}", "${NGINX_uri}", "${NGINX_upstream_addr}", "${NGINX_host }", "${NGINX_upstream_response_length}", "${NGINX_upstream_status}", "${NGINX_server_name}", "${NGINX_$http_host}", "${NGINX_upstream_response_time}")
indexes("NGINX_request", "NGINX_uri", "NGINX_server_name"));
};
log {source(nginx_acceess_log); parser(p_nginx_acceess_log); destination(d_postgres_nginx_acceess_log); };
###########################################################################################################
####Nginx error log parsing
source s_tail_nginx_error { file( "/var/log/nginx/error.log"
follow_freq(1)
flags(no-parse)
);
};
destination d_file_nginx_error_log{
sql(type(pgsql)
host("$POSTGRES_HOST") port("5432") username("site_logs") password("$PG_PASSWORD")
database("site_logs")
table("${HOST}_${R_YEAR}${R_MONTH}${R_DAY}_nginx_error")
columns("datetime varchar(16)", "host varchar(32)", "program varchar(20)", "pid varchar(10)", "message varchar(800)")
values("$R_DATE", "$HOST", "$PROGRAM", "$PID", "$MSG")
indexes("datetime", "host", "program", "pid", "message"));
};
log { source(s_tail_nginx_error ); destination(d_file_nginx_error_log);
};
###########################################################################################################
####node_error_log_parsing
source s_tail_node { file( "/root/.pm2/logs/server-error.log"
follow_freq(1)
flags(no-parse)
);
};
destination d_file_node_error{
sql(type(pgsql)
host("$POSTGRES_HOST") port("5432") username("site_logs") password("$PG_PASSWORD")
database("site_logs")
table("${HOST}_${R_YEAR}${R_MONTH}${R_DAY}_nodejs_error")
columns("datetime varchar(16)", "host varchar(32)", "program varchar(20)", "pid varchar(10)", "message varchar(800)")
values("$R_DATE", "$HOST", "$PROGRAM", "$PID", "$MSG")
indexes("datetime", "host", "program", "pid", "message"));
};
log { source(s_tail_node); destination(d_file_node_error);
};
Проверяем
sudo /usr/sbin/syslog-ng -Fvde
Если всё ок – стартуем
sudo /etc/init.d/syslog-ng start
Отправка логов на сервер syslog-ng от syslog-ng и вставка логов в postgresql,elasticsearch
Для того чтобы писать не напрямую в базу а в сервер логов syslog-ng, который уже будет отпралять это в базу NOsql elasticsearch или в SQL postgres нам понадобится внести изменения. Наш клиент будет отправлять логи на сервер по udp.
Настройка на клиенте.
Создадим отдельный файл с конфигом отправки логов. Удалим последние изменения – именно удалим блок с отправкой логов и создадим файл в
/etc/syslog-ng/conf.d/output.conf
Вставим туда следующее содержимое
#################################БЛОК1######################################################
############################################################################################
############################################################################################
####Отправляем логи logserver43
destination syslog_server {
 udp("logserver43" port(25214));
 };
###### Какой файл парсим
source nginx_acceess_log { file( "/var/log/nginx/access_logtodb.log"
                    follow_freq(1)
                    flags(no-parse)
     );
};
###### Парсим файл, который был создан в формате csv
parser p_nginx_acceess_log {
    csv-parser(columns("NGINX_TIME", "NGINX_http_host", "NGINX_remote_addr", "NGINX_http_x_forwarded_for", "NGINX_request", "NGINX_request_method","NGINX_status", "NGINX_body_bytes_sent", "NGINX_http_referer", "NGINX_request_time", "NGINX_upstream_http_x_cache", "NGINX_uri", "NGINX_upstream_addr", "NGINX_host", "NGINX_upstream_response_length", "NGINX_upstream_status", "NGINX_server_name", "NGINX_newurl", "NGINX_upstream_response_time","NGINX_user_agent")
         flags(escape-double-char,strip-whitespace)
         delimiters(";")
         quote-pairs('""[]')
         );
};
###### Строка отправки лога с блоком парсера на удаленный сервер
log {source(nginx_acceess_log);  parser(p_nginx_acceess_log); destination(syslog_server); };
############################################################################################
############################################################################################
Настройка на сервере.
Создадим отдельный файл с конфигом отправки логов. Удалим последние изменения – именно удалим блок с отправкой логов и создадим файл в.
/etc/syslog-ng/conf.d/input.conf
##Прием логов с удаленных машин по udp на порт 25214
source remote_log_host {
 udp(port(25214));
};
####Добавляем назначение логов - куда пишем
###Кладем в postgresql
destination d_postgres_nginx_acceess_log{
  sql(type(pgsql)
  host("127.0.0.1")  port("6432") username("site_parser_logs") password("пароль_пользователя")
  database("site_parser_logs")
  table("Remote_host_site_logs")
  columns("DATE text","NGINX_TIME text", "NGINX_http_host text", "NGINX_remote_addr text", "NGINX_http_x_forwarded_for text", "NGINX_request_method text", "NGINX_request text", "NGINX_status text",  "NGINX_body_bytes_sent text",  "NGINX_http_referer text", "NGINX_request_time text", "NGINX_upstream_http_x_cache text", "NGINX_uri text", "NGINX_upstream_addr text",  "NGINX_host  text", "NGINX_upstream_response_length text", "NGINX_upstream_status text", "NGINX_server_name text", "NGINX_newurl text", "NGINX_upstream_response_time text", "NGINX_user_agent text")
  values("${R_DATE}","${NGINX_TIME}", "${NGINX_http_host}", "${NGINX_remote_addr}", "${NGINX_http_x_forwarded_for}", "${NGINX_request_method}", "${NGINX_request}", "${NGINX_status}", "${NGINX_body_bytes_sent}", "${NGINX_http_referer}", "${NGINX_request_time}", "${NGINX_upstream_http_x_cache}", "${NGINX_uri}", "${NGINX_upstream_addr}", "${NGINX_host }", "${NGINX_upstream_response_length}", "${NGINX_upstream_status}", "${NGINX_server_name}", "${NGINX_newurl}", "${NGINX_upstream_response_time}", "${NGINX_user_agent}")
  indexes( "NGINX_newurl"));
};
###Кладем в elasticsearch
destination d_elastic {
  elasticsearch2(
    #client-lib-dir("/usr/share/elasticsearch/lib/")
    index("elasticsearch-${YEAR}.${MONTH}.${DAY}")
    type("test")
    time-zone("UTC")
    client_mode("http")
    flush-limit("10000")
    cluster_url("http://elasticsearchhost:9200")
    custom_id("${UNIQID}")
    template("$(format_json --scope nv_pairs --key ISODATE @timestamp=${ISODATE})")
  );
};
####Блок с парсером принятых логов  nginx на порт
parser p_remote_log_host {
    csv-parser(columns("NGINX_TIME", "NGINX_http_host", "NGINX_remote_addr", "NGINX_http_x_forwarded_for", "NGINX_request", "NGINX_request_method","NGINX_status", "NGINX_body_bytes_sent", "NGINX_http_referer", "NGINX_request_time", "NGINX_upstream_http_x_cache", "NGINX_uri", "NGINX_upstream_addr", "NGINX_host", "NGINX_upstream_response_length", "NGINX_upstream_status", "NGINX_server_name", "NGINX_newurl", "NGINX_upstream_response_time","NGINX_user_agent")
         flags(escape-double-char,strip-whitespace)
         delimiters(";")
         quote-pairs('""[]')
         );
};
###Кладем в elasticsearch
log {source(remote_log_host);  parser(p_remote_log_host); destination(d_elastic); };
###Кладем в postgres
log {source(remote_log_host);  parser(p_remote_log_host); destination(d_postgres_nginx_acceess_log); };
Все рестартуем агенты на сервере и отправителе.
sudo /etc/init.d/syslog-ng restart
Заходим в kibana на
https://127.0.0.1:5601
Добавляем индекс
lasticsearch-*
В поле timestamp выбираем
@timestamp

Смотрим в discover наши логи
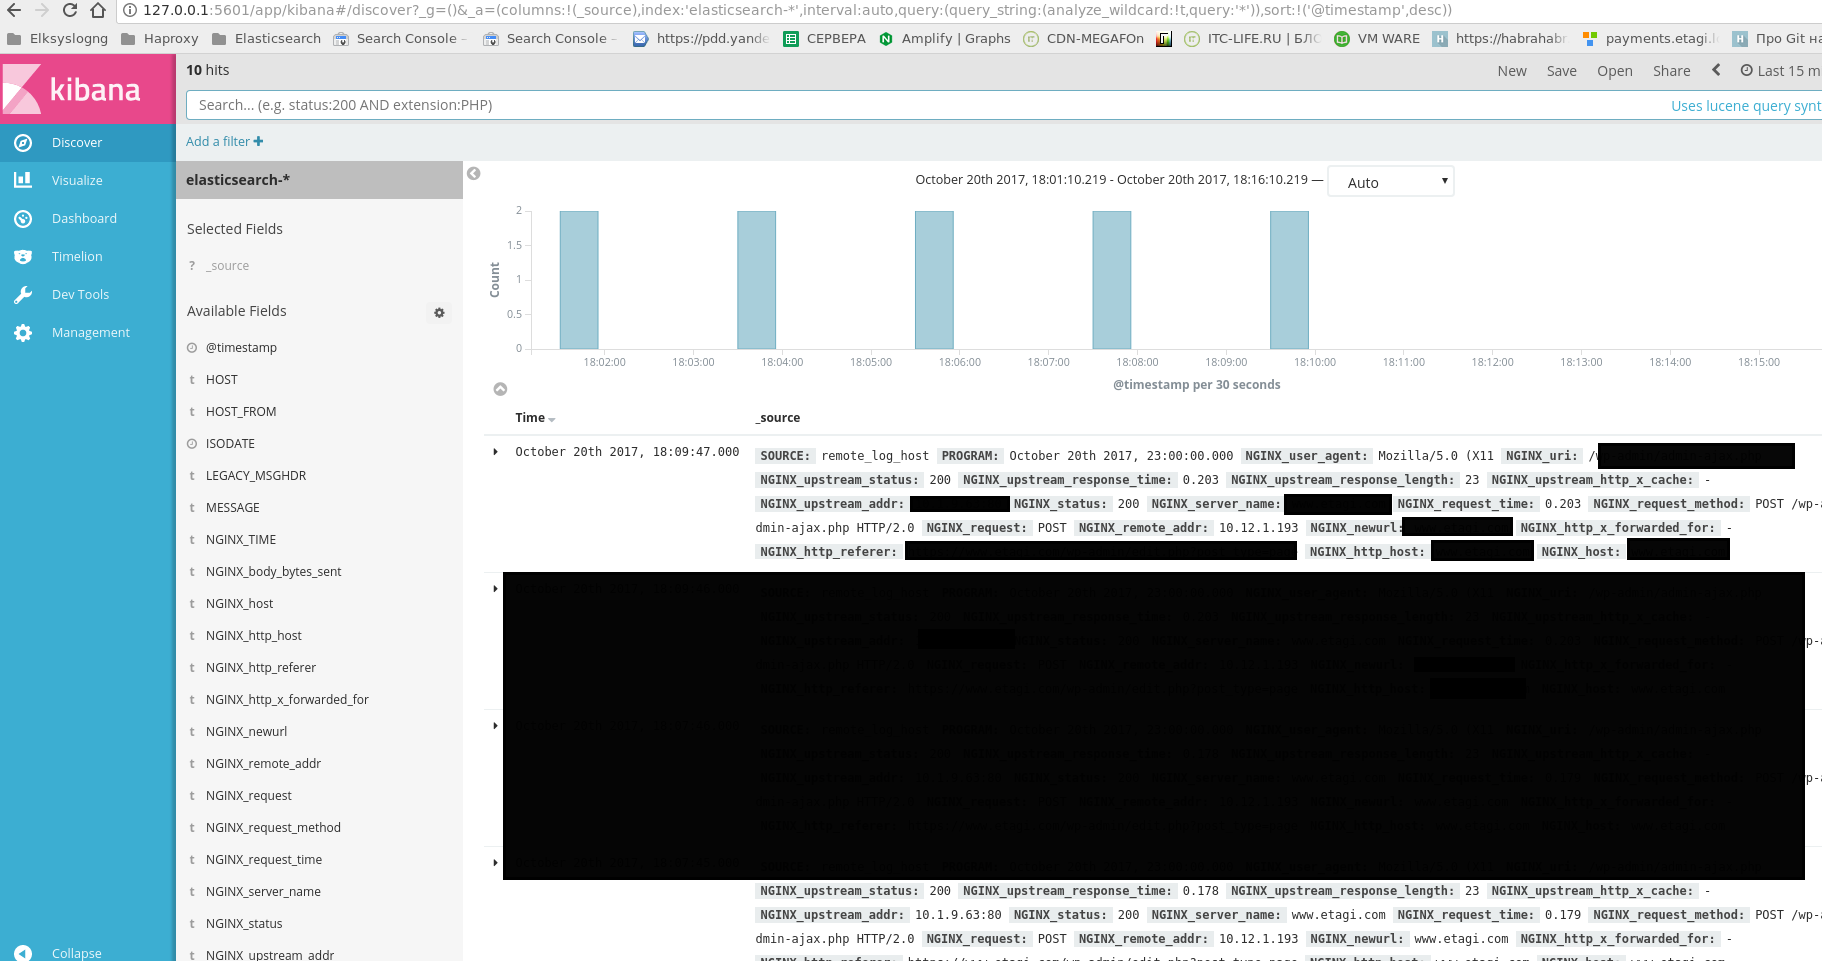
Все разложено как и надо по парам!!!
Скрипт очистки логов nginx чтобы не засирать систему. Тут также td-agent – не обращаем на него внимания.
#!/bin/bash
kill -9 $(/bin/ps uax | grep  'td-agent' | /usr/bin/awk ' { print $2} ')
/bin/sleep 5;
rm -rf /var/log/nginx/*.log
/bin/sleep 1;
echo "Переинициализация логов nginx"
[ ! -f /var/run/nginx.pid ] || /bin/kill -USR1 `/bin/cat /var/run/nginx.pid`
echo "Рестарую td-agent"
/etc/init.d/td-agent restart
echo "Смотрим процессы"
/bin/ps aux | grep nginx
/etc/init.d/td-agent status
Добавляем его по крону каждые 2 часа